

Celina, TX Real Estate: A Comprehensive Analysis of the 2022 Single-Family Residential Housing Market
The 2022 real estate market in Celina, Texas underwent notable transformations as rising mortgage rates redefined both buyer behavior and seller strategies. This analysis explores the key trends, pricing fluctuations, and standout properties, offering a comprehensive overview of the market’s shifting dynamics.
Key Takeaways and Trends from the 2022 Real Estate Market in Celina, TX
Pricing Range
Property prices ranged from $143,000 to an astonishing $7,000,000. This vast range underscores the diversity of homes, from entry-level to high-end luxury properties.
Market Efficiency
Homes continued to sell quickly, with an average of 27 days on the market. Sellers achieved close to or above listing prices, reflecting balanced efficiency in transactions despite buyer caution due to rising interest rates.
Unique Outliers
The most expensive property sold for $7,000,000, primarily for land value rather than the structure, indicating the importance of location-driven purchases in higher price brackets.
Mortgage Rate Impact
The average 30-year fixed mortgage rate rose to 5.53%, leading to adjustments in buyer affordability. To compensate, builders increasingly offered incentives, while individual sellers leaned into concessions to close deals.
Total Homes Closed
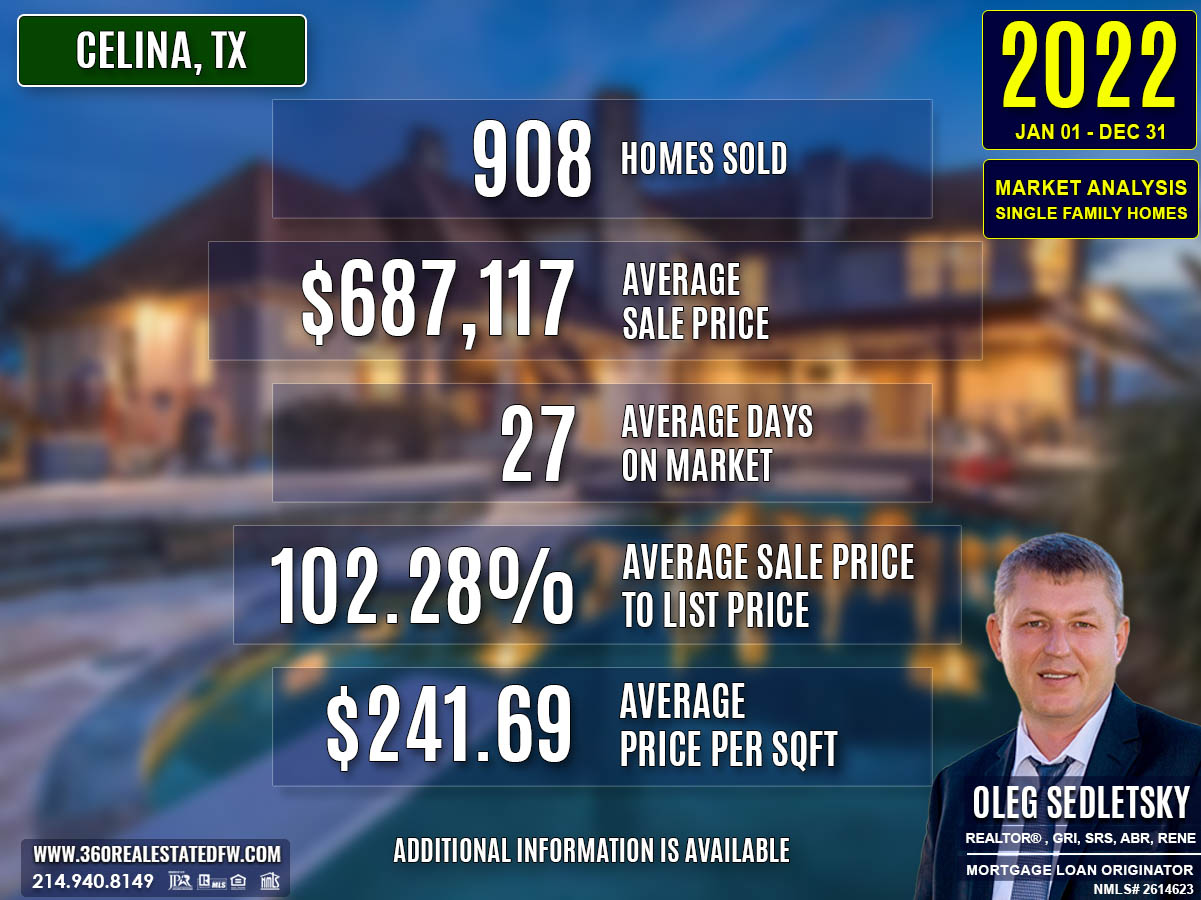
A total of 908 homes were sold in 2022, representing a continued reduction from previous years. Among them, 309 were new construction homes, showing developers adapting cautiously to market trends. Also, 77 homes with pools were sold, highlighting sustained demand for luxury and lifestyle-enhancing features.
Property Pricing Insights
- Minimum Price: $143,000
- Maximum Price: $7,000,000
- Average Price: $687,117
- Median Price: $630,949
While the average and median prices reflect a strong demand for mid-to-upper-tier homes, the high-end market saw growth as evidenced by the significant increase in the maximum price compared to prior years.
Property Size and Features
- Average Bedrooms: 4
- Average Bathrooms: 3
- Average Square Footage: 2,861 sq. ft.
- Average Lot Size: 0.369 acres
Properties offered ample space for buyers, aligning with post-pandemic preferences for larger homes that accommodate flexible living arrangements.
Market Dynamics
- Average Days on Market (DOM): 27 days
- Average Close Price to Listing Price (ClsPr/LstPr): 102.28%
- Average Close Price to Original Listing Price (ClsPr/OLP): 101.36%
- Average Price Per Square Foot: $241.69
Homes moved briskly, often selling above the initial listing price. This trend reflects a still-competitive market despite cooling demand in some segments due to rising borrowing costs.
Insights into the Most Expensive Celina, TX Property Sold in 2022
The most expensive property sold in 2022 was a unique asset, purchased mainly for its land value rather than the home itself. Key highlights of this sale include:
- Price: $7,000,000
- Lot Size: 37.614 acres
- Days on Market: 120 days
- ClsPr/LstPr: 80.00%
- ClsPr/OLP: 80.00%
This acreage underscores demand for prime development opportunities in growth areas, positioning such sales as pivotal in driving broader market dynamics, especially in the luxury sector.
Economic context
Average Electricity Costs in Dallas-Fort Worth in 2022
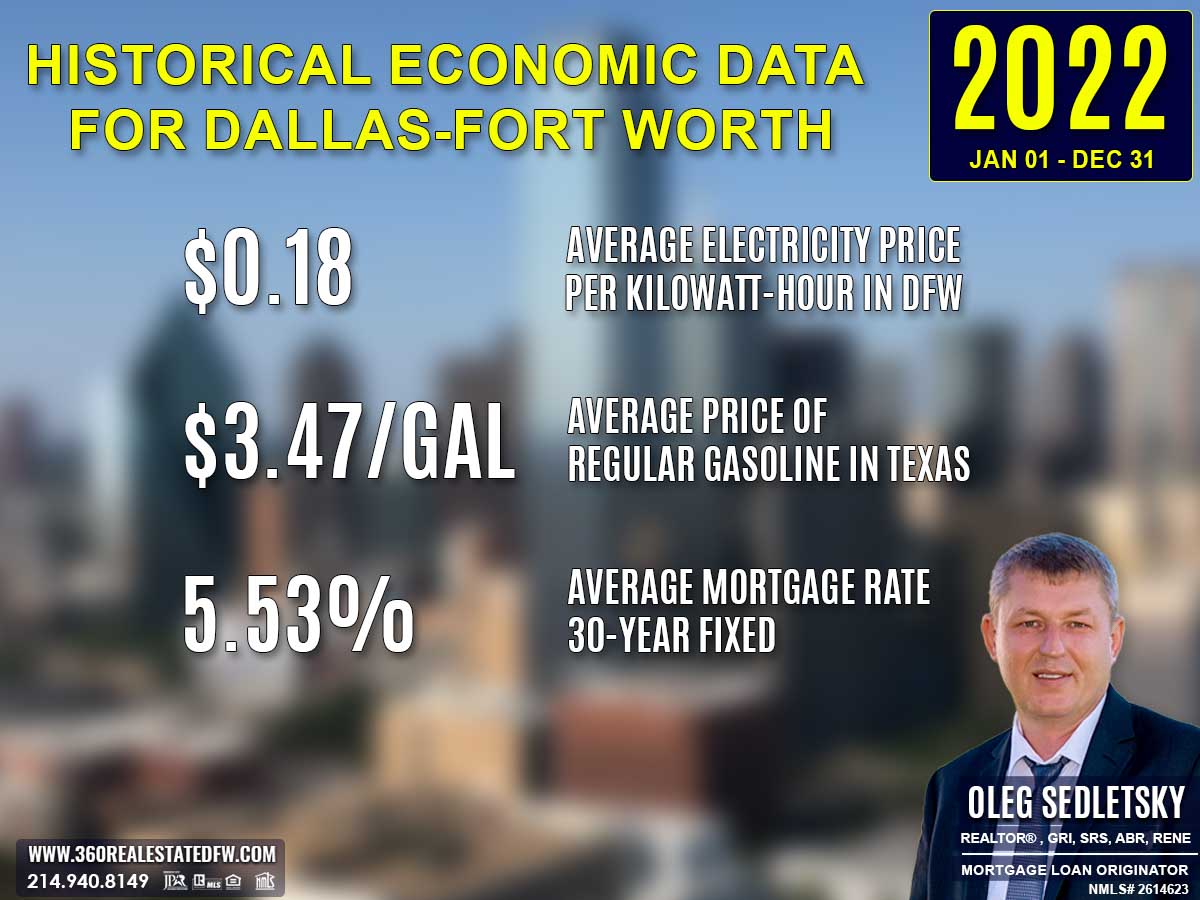
Average electricity prices spiked to $0.18 per kilowatt-hour in 2022, a sharp increase from $0.14 in 2021. Higher energy expenses placed added strain on household budgets, driving demand for energy savings. Homes with modern insulation, solar installations, or energy-saving appliances gained significant appeal during this period.
Average Price for Regular Gasoline in Texas in 2022
Gas prices surged to $3.47 per gallon in 2022, jumping from $2.65 in 2021. The substantial increase in transportation costs likely swayed homebuyers to favor central locations or areas close to public transit. Long commutes to suburban or rural homes might have lost some appeal in light of elevated gas prices.
Average 30-Year Fixed Mortgage Rate in 2022
Mortgage rates climbed steeply to 5.53% in 2022, up from 3.15% the year before. The notable rise in rates significantly impacted affordability, persuading many to reassess their homeownership goals. Homebuyers were urged to secure pre-approval with a local mortgage loan originator to better understand their financial limits in a tightened market.
Curious about today’s mortgage rates and the home you can comfortably afford?
Submit a no-obligation mortgage application today and get pre-approved to determine your budget and take the first step toward homeownership with confidence.
Overview of Differences Between the 2022 and 2021 Real Estate Markets in Celina, Texas
Total Homes Sold
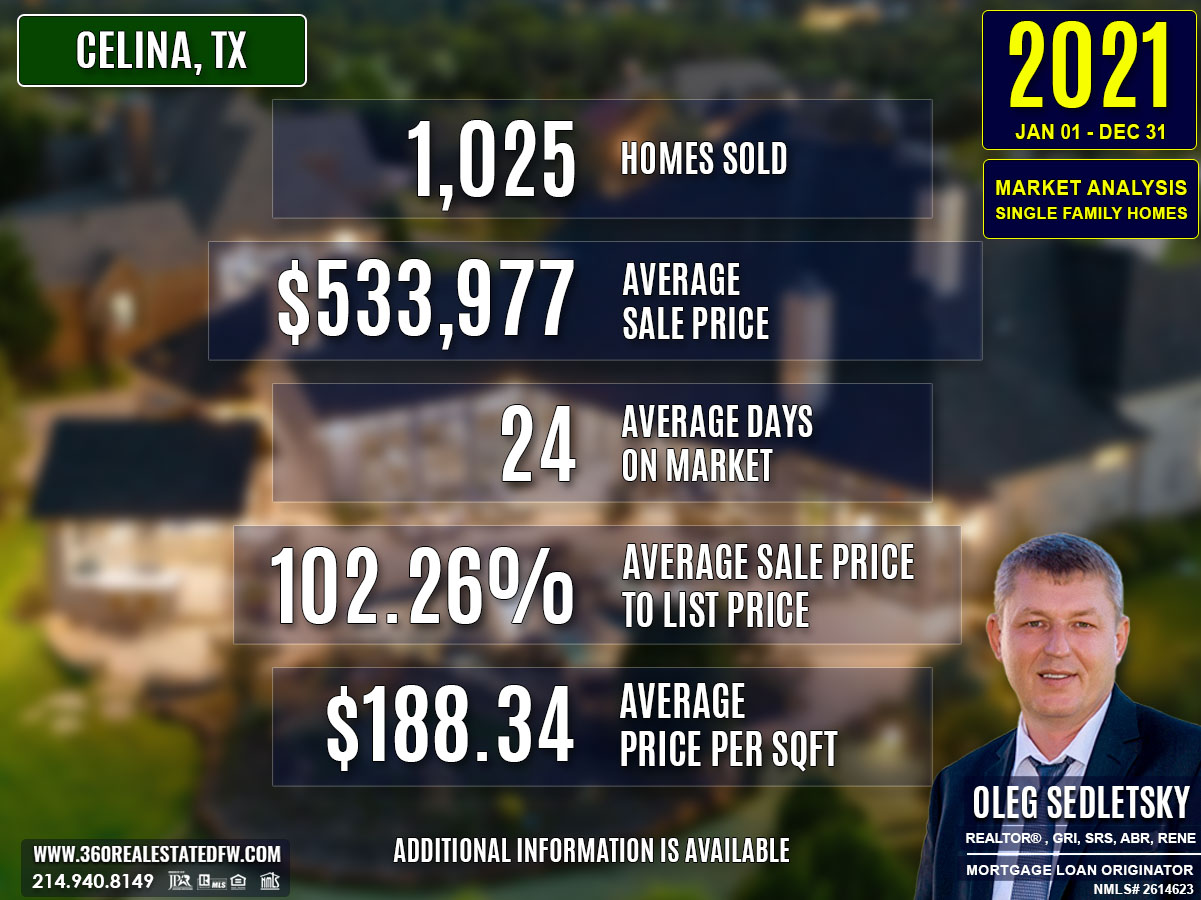
2021: 1,025
2022: 908
The number of homes sold decreased by 11.4%. This reflects tighter inventory and challenges posed by higher mortgage rates, which are impacting buyer activity.
Number of Homes with Pools
2021: 72
2022: 77
An increase of 5 homes with pools sold highlights the steady demand for homes featuring lifestyle-enhancing amenities.
Number of New Construction Homes
2021: 393
2022: 309
New construction sales dropped by 21.4%, indicating a pullback in development or slower absorption of newly built properties.
Average Sales Price
2021: $533,977
2022: $687,117
The average sales price increased by 28.7%, driven by demand for mid- to high-tier properties and inflationary pressures on home valuations.
Average Days on Market (DOM)
2021: 24 days
2022: 27 days
Homes spent an average of 3 more days on the market, signaling a slight cooling in the pace of transactions.
Average Price Per Square Foot
2021: $188.34
2022: $241.69
The average price per square foot rose by 28.3%, reflecting higher property values and competitive buyer demand for available inventory.
Most Expensive Property Sold
2021: $2,459,000 (27 acres, 5 beds, 4 baths)
2022: $7,000,000 (37.6 acres, 3 beds, 2 baths)
The most expensive property sold increased by 184.7% in value, with the 2022 sale reflecting the high valuation of land in prime development areas. The significant difference underscores the importance of large undeveloped parcels in growth zones.
Summary of Real Estate Market Analysis for Celina, TX in 2022
The 2022 real estate market in Celina, Texas reflected notable shifts, with rising mortgage rates playing a central role in shaping both buyer behavior and seller strategies. Despite these challenges, the market displayed resilience, with opportunities for both buyers and sellers to succeed when equipped with the right knowledge and support from experienced real estate professionals.
Homebuyers and First-Time Homebuyers Perspective
For homebuyers, especially first-time buyers, navigating the market required strong preparation and strategic planning. Mortgage pre-approval proved to be a critical step, allowing buyers to understand their financial limits and position themselves as credible contenders in competitive situations. The guidance of skilled realtors further enhanced the experience, offering invaluable market insights, negotiation expertise, and clarity in decision-making. Home-Buyers benefited greatly from staying informed, working with professionals, and adapting to economic changes such as fluctuating interest rates.
Home-Sellers Perspective
For home sellers, the year highlighted the importance of strategic pricing and marketing to attract buyers amidst a shifting landscape. Many relied heavily on the marketing strategies and expert advice of realtors to showcase their properties effectively and secure the best possible outcomes. From pricing homes accurately to promoting key features like pools or acreage, realtors provided the expertise needed to maximize property appeal. Sellers who partnered with professionals were better prepared to adjust to buyer demands and leverage concessions to close deals successfully.
Final Thoughts
Ultimately, the 2022 Celina, TX real estate market underscored that both buyers and sellers thrive when they are informed and prepared. Knowledgeable realtors played a vital role in providing the insights and strategies critical to navigating a dynamic market. For buyers, a pre-approved mortgage and the guidance of an experienced professional ensured smoother transactions and better outcomes. For sellers, the strategic advice and marketing acumen of realtors were essential elements for success. Whether buying or selling, a proactive approach and collaboration with a trusted real estate expert were the keys to achieving goals in an evolving market.
Why Historical Statistical Data Matters in the Celina, Texas Real Estate Market
Did you know that Appraisers and Realtors rely on historical statistical data to determine a property’s current value?
The information presented above is just a small glimpse into the wealth of essential data available to help both homebuyers and sellers set realistic expectations and gain an initial understanding of the real estate market in Celina, Texas. Real estate transactions are intricate, and what you see here is merely a sample of the many factors at play in each deal in this city.
Beyond these insights, a comprehensive analysis is available that focuses on specific aspects like zip codes, neighborhoods, and homes within certain school districts in Celina. This granular data dives deeper into market trends, allowing for a precise understanding of local dynamics. Additionally, historical data plays a critical role in crafting informed strategies, providing the context needed to make confident decisions that align with your goals.
Unlock Exceptional Service!
Assistance with all your real estate needs in the Dallas-Fort Worth area is just a click or call away. Reach out at 214-940-8149 or connect through the links below.
Meet Your Trusted Realtor and Mortgage Expert in Celina, Texas!

Greetings! I’m Oleg Sedletsky, and I’m excited to introduce myself as your go-to full-time licensed Texas REALTOR® and Mortgage Loan Originator.
I proudly represent JPAR® – Real Estate Brokerage as a REALTOR® and Utopia Mortgage LLC as a Mortgage Loan Originator! My designations and certifications reflect my dedication to helping you achieve your real estate goals in CELINA, TX and other locations in the vibrant Dallas-Fort Worth area!
Whether you’re a homebuyer or a home seller, the information on this page highlights just a fraction of what’s important to know about the Celina, TX real estate market. Data like this is key to understanding trends, making informed decisions, and achieving your real estate goals.
The good news? I can provide much more. When you choose me as your real estate agent, you’ll gain access to detailed neighborhood analyses, historical trends, and everything you need to make confident decisions. Whether you’re buying your dream home or securing the best deal on a sale, I’ll guide you every step of the way with peace of mind.
I’d love to be your trusted advisor in this exciting journey. With a commitment to ongoing professional development, I’m always improving to serve you better. Plus, I’m fluent in English, Ukrainian, and Russian and ready to help whenever you’re ready.
If you’re looking for a dedicated, experienced professional, contact me today!
It’s All About You and Your Real Estate Goals!
My mission is to serve you! With my knowledge and expertise, I’m here to help you achieve all your real estate goals!
I’m passionate about helping homebuyers and home-sellers navigate the exciting real estate landscape in Celina, Texas! Whether you’re searching for your dream home, exploring land options, or looking for commercial properties, my Real Estate Services have you covered.
Contact me today for all your real estate needs in Celina, Texas! Call/text 214-940-8149

A Comprehensive Analysis of Single-Family Residential Housing Market in Celina, TX: 2010 to Present
Discover the trends, stats, and insights shaping Celina’s real estate market year by year!
2010-2020
Celina, TX Real Estate Market Report 2010: Analysis and Trends
Celina, TX Real Estate Market Report 2011: Analysis and Trends
Celina, TX Real Estate Market Report 2012: Analysis and Trends
Celina, TX Real Estate Market Report 2013: Analysis and Trends
Celina, TX Real Estate Market Report 2014: Analysis and Trends
Celina, TX Real Estate Market Report 2015: Analysis and Trends
Celina, TX Real Estate Market Report 2016: Analysis and Trends
Celina, TX Real Estate Market Report 2017: Analysis and Trends
Celina, TX Real Estate Market Report 2018: Analysis and Trends
Celina, TX Real Estate Market Report 2019: Analysis and Trends
Celina, TX Real Estate Market Report 2020: Analysis and Trends
This market analysis is intended solely for educational purposes. This market analysis is based on data sourced from NTREIS, Inc. This analysis is exclusively focused on single-family homes and does not account for other property types. The total number of real estate transactions within the specified period and location may vary. Data accuracy cannot be guaranteed due to potential input errors made by NTREIS users. This market analysis does not account for all new construction home sales. If you need detailed information about recorded property sales or other public records, please contact the appropriate city or county office.

Celina, TX Real Estate: A Comprehensive Analysis of the 2021 Single-Family Residential Housing Market
The 2021 real estate market in Celina, TX experienced notable transformations shaped by the continuing impact of the COVID-19 pandemic in its second year. A growing demand for spacious homes and outdoor amenities drove a sharp increase in average home prices, while properties spent significantly less time on the market. This analysis delves into the key trends, pricing shifts, and standout properties, providing a detailed overview of the market’s evolving dynamics.
Key Takeaways and Trends from the 2021 Real Estate Market in Celina, TX
Pricing Range
Home prices ranged from $140,000 to $2,459,000, with a notable increase in average and median prices compared to the years prior. These figures highlight increased housing demand and overall price appreciation.
Market Efficiency
Listings sold at record speeds, averaging 24 days on the market, a significant drop from previous years. Many properties achieved or exceeded listing prices, reflecting high market competitiveness.
Unique Outliers
High-value unique homes dominated headlines, such as the most expensive property sold at $2,459,000. This custom-built, sprawling home featured over 27 acres and luxury amenities, providing a stark contrast to the market’s median home profile.
Mortgage Rate Impact
A continued decline in the 30-year fixed mortgage rate to an average of 3.15% in 2021 prompted homebuyers to take advantage of affordable financing, amplifying competition and supporting higher sale prices.
Total Homes Closed
A total of 1,025 homes were sold during 2021. Among these sales, new construction homes accounted for 393, demonstrating a solid interest in modern builds. Additionally, 72 properties with pools were sold, marking an upward trend as buyers continued to value outdoor living options.
Property Pricing Insights
- Minimum Price: $140,000
- Maximum Price: $2,459,000
- Average Price: $533,977
- Median Price: $494,432
These figures highlight the broad scope of the market, spanning attainable homes to luxury estates. Average and median prices surged significantly year-over-year, emphasizing overall demand.
Property Size and Features
- Bedrooms: Averaged 4, with ranges from 1 to 6.
- Bathrooms: Averaged 3, with a maximum of 8.
- Square Footage: Properties averaged 2,839 sq. ft., with the largest spanning 5,957 sq. ft.
- Lot Size: Median lot size was 0.162 acres, with some estates extending up to 27.73 acres.
Families sought more spacious layouts and outdoor acreage, leading to demand growth in distinctly larger properties.
Market Dynamics
- Days on Market (DOM): Averaged 24 days, reflecting faster transactions.
- Average Close Price to Listing Price (ClsPr/LstPr): 102.26%, indicating competitive bidding with many buyers paying above the listed price.
- Average Close Price to Original Listing Price (ClsPr/OLP): 105.57%, showing that even properties with reduced list prices often sold above initial valuations.
- Average Price Per Square Foot: $188.34, reinforcing rising valuations across all home types.
Insights into the Most Expensive Celina, TX Property Sold in 2021
The most expensive sale of the year was a luxurious custom-built home sold for $2,459,000. Spanning 27 acres, this 3-story home featured unmatched luxury with hardwood floors, vaulted ceilings, and four balconies. Additional amenities included a 3-acre stocked pond with a dock and a 4,000 sq. ft. barn.
Property Highlights
- Price: $2,459,000
- Beds/Baths: 5 beds, 4 baths (3 full, 1 half)
- Square Footage: 5,391 sq. ft. ($456.13 per sq. ft.)
- Lot Size: 27.73 acres
- DOM: 108 days
- ClsPr/LstPr: 98.56%
- ClsPr/OLP: 98.56%
- Year Built: 1998
This property underlined the demand for exclusive luxury estates with extensive land and premium amenities. While tied to a niche buyer demographic, its sale encouraged market strength in high-value property sectors.
Economic context

Average Electricity Costs in Dallas-Fort Worth in 2021
Electricity prices rose again to $0.14 per kilowatt-hour in 2021, up from $0.13 in 2020. This upward trend in energy costs likely pushed buyers to prioritize homes with efficient heating and cooling systems. Green-certified homes may have seen increased interest as buyers sought to offset higher utility bills.
Average Price for Regular Gasoline in Texas in 2021
Gas prices climbed to $2.65 per gallon in 2021, up from $1.82 in the prior year. This sharp increase put pressure on household budgets, especially for buyers with long commutes. Urban properties or homes in transit-accessible locations likely became more appealing as buyers aimed to minimize transportation expenses.
Average 30-Year Fixed Mortgage Rate in 2021
The average 30-year fixed mortgage rate dropped slightly to 3.15% in 2021, down from 3.38% in 2020. This decline further fueled homebuying demand, making mortgages more affordable despite rising home prices. Potential homebuyers were strongly advised to secure pre-approval through local mortgage loan originators to enhance their financial readiness during highly competitive conditions.
Curious about today’s mortgage rates and the home you can comfortably afford?
Submit a no-obligation mortgage application today and get pre-approved to determine your budget and take the first step toward homeownership with confidence.
Overview of Differences Between the 2021 and 2020 Real Estate Markets in Celina, Texas
Total Homes Sold
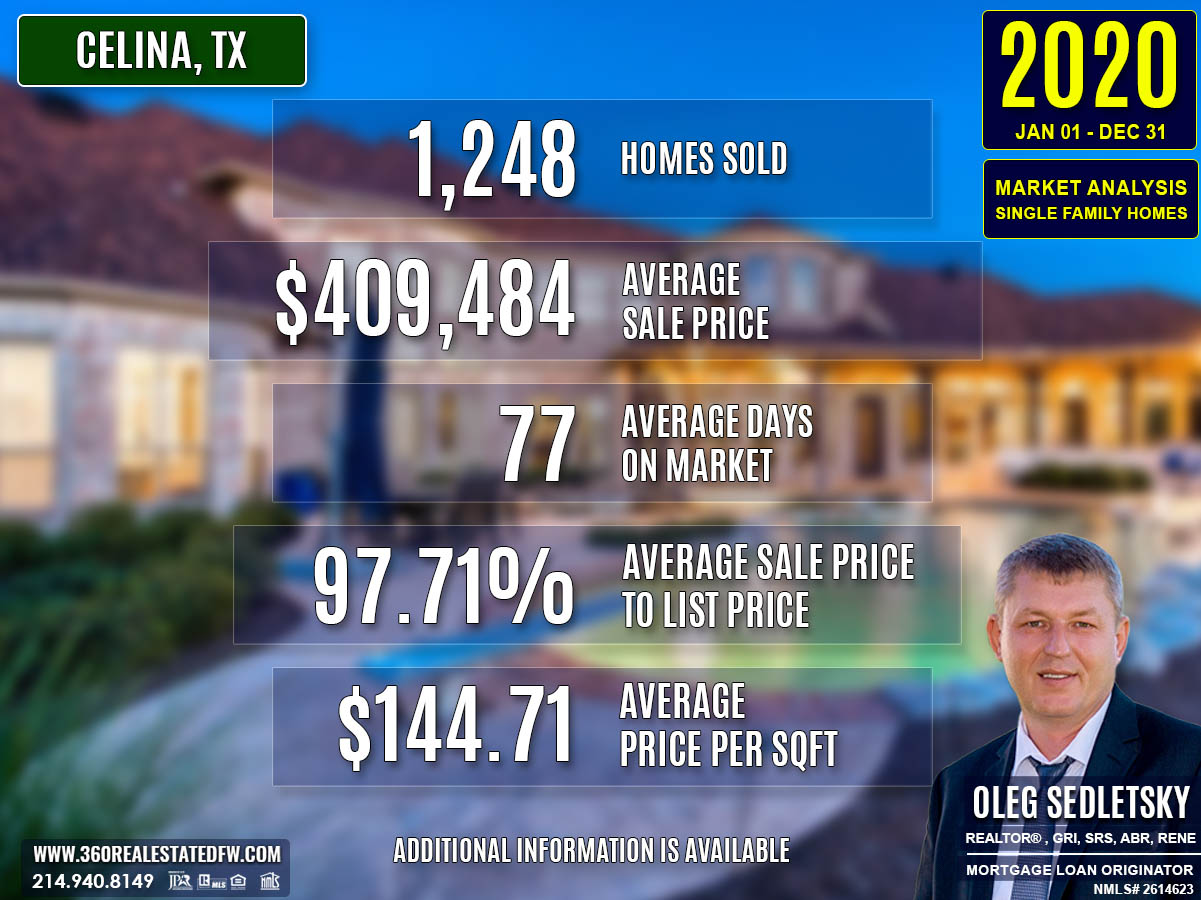
2020: 1,248
2021: 1,025
Total homes sold decreased by 18%. This change highlights the impact of limited inventory resulting from the pandemic.
Number of Homes with Pools
2020: 64
2021: 72
Sales of homes with pools grew by 13%, emphasizing buyers’ increasing interest in outdoor and leisure features for at-home living.
Number of New Construction Homes
2020: 751
2021: 393
New construction sales declined by 48%, possibly due to supply chain disruptions, labor shortages, or a slowdown in builder completions during 2021.
Average Sales Price
2020: $409,484
2021: $533,977
The average sales price increased by 30%, driven by high demand, historically low mortgage rates, and buyers’ preference for upgraded and larger homes.
Average Days on Market (DOM)
2020: 77 days
2021: 24 days
Homes sold 68% faster in 2021, highlighting a highly competitive market with accelerated transactions due to sustained buyer urgency.
Average Price Per Square Foot
2020: $144.71
2021: $188.34
The price per square foot rose by 30%, reflecting overall property appreciation and limited housing supply elevating individual home values.
Most Expensive Property Sold
2020: $1,575,000 (5 beds, 4 baths, 5,174 sq. ft., $304.41 per sq. ft., 21 acres)
2021: $2,459,000 (5 beds, 4 baths, 5,391 sq. ft., $456.13 per sq. ft., 27.73 acres)
The most expensive property sold increased by 56% in value. This highlights heightened competition in the luxury sector and a demand for unique, estate-style properties with expansive land and exclusive amenities.
Summary of Real Estate Market Analysis for Celina, TX in 2021
The 2021 real estate market in Celina, Texas exemplified resilience and growth amidst ongoing challenges. With a mix of high demand, low inventory, and evolving buyer priorities, the market offered opportunities and posed challenges for both homebuyers and sellers. Experienced realtors played a pivotal role in guiding clients through these complexities, making preparation and expertise more valuable than ever.
Homebuyers and First-Time Homebuyers Perspective
For homebuyers, especially first-time buyers, navigating the market required more than just enthusiasm; it demanded strategy and knowledge. Securing mortgage pre-approval was critical in a competitive environment where homes sold quickly and often above list price. First-time homebuyers benefited immensely from working with skilled realtors who provided insights into pricing, neighborhoods, and bidding strategies. Being well-informed and prepared allowed buyers to make confident decisions, ensuring they could move swiftly in a fast-paced market.
Home-Sellers Perspective
Home sellers in 2021 relied heavily on realtor marketing expertise and strategic advice to position their properties optimally. With demand levels high, experienced realtors guided sellers to set competitive listing prices, stage homes effectively, and attract serious buyers. These efforts translated into faster closings and maximized returns. Sellers greatly benefited from their realtors’ knowledge of market dynamics, ensuring a smooth and profitable home selling process.
Final Thoughts
The 2021 market underscored the importance of preparation and expert guidance for both buyers and sellers. Homebuyers who worked with experienced realtors gained valuable insights and support, helping them stay competitive and informed. Likewise, home-sellers leveraged their realtors’ marketing skills and understanding of buyer behavior to achieve successful outcomes.
Whether buying or selling, being well-prepared was the key to making informed decisions. With the continued support of knowledgeable realtors, individuals were equipped to thrive in a rapidly changing market. This dynamic collaboration between clients and real estate professionals ensured success and contributed to Celina’s flourishing real estate landscape.
Why Historical Statistical Data Matters in the Celina, Texas Real Estate Market
Did you know that Appraisers and Realtors rely on historical statistical data to determine a property’s current value?
The information presented above is just a small glimpse into the wealth of essential data available to help both homebuyers and sellers set realistic expectations and gain an initial understanding of the real estate market in Celina, Texas. Real estate transactions are intricate, and what you see here is merely a sample of the many factors at play in each deal in this city.
Beyond these insights, a comprehensive analysis is available that focuses on specific aspects like zip codes, neighborhoods, and homes within certain school districts in Celina. This granular data dives deeper into market trends, allowing for a precise understanding of local dynamics. Additionally, historical data plays a critical role in crafting informed strategies, providing the context needed to make confident decisions that align with your goals.
Unlock Exceptional Service!
Assistance with all your real estate needs in the Dallas-Fort Worth area is just a click or call away. Reach out at 214-940-8149 or connect through the links below.
Meet Your Trusted Realtor and Mortgage Expert in Celina, Texas!
Greetings! I’m Oleg Sedletsky, and I’m excited to introduce myself as your go-to full-time licensed Texas REALTOR® and Mortgage Loan Originator.
I proudly represent JPAR® – Real Estate Brokerage as a REALTOR® and Utopia Mortgage LLC as a Mortgage Loan Originator! My designations and certifications reflect my dedication to helping you achieve your real estate goals in CELINA, TX and other locations in the vibrant Dallas-Fort Worth area!
Whether you’re a homebuyer or a home seller, the information on this page highlights just a fraction of what’s important to know about the Celina, TX real estate market. Data like this is key to understanding trends, making informed decisions, and achieving your real estate goals.
The good news? I can provide much more. When you choose me as your real estate agent, you’ll gain access to detailed neighborhood analyses, historical trends, and everything you need to make confident decisions. Whether you’re buying your dream home or securing the best deal on a sale, I’ll guide you every step of the way with peace of mind.
I’d love to be your trusted advisor in this exciting journey. With a commitment to ongoing professional development, I’m always improving to serve you better. Plus, I’m fluent in English, Ukrainian, and Russian and ready to help whenever you’re ready.
If you’re looking for a dedicated, experienced professional, contact me today!
It’s All About You and Your Real Estate Goals!
My mission is to serve you! With my knowledge and expertise, I’m here to help you achieve all your real estate goals!
I’m passionate about helping homebuyers and home-sellers navigate the exciting real estate landscape in Celina, Texas! Whether you’re searching for your dream home, exploring land options, or looking for commercial properties, my Real Estate Services have you covered.
Contact me today for all your real estate needs in Celina, Texas! Call/text 214-940-8149
A Comprehensive Analysis of Single-Family Residential Housing Market in Celina, TX: 2010 to Present
Discover the trends, stats, and insights shaping Celina’s real estate market year by year!
2010-2020
Celina, TX Real Estate Market Report 2010: Analysis and Trends
Celina, TX Real Estate Market Report 2011: Analysis and Trends
Celina, TX Real Estate Market Report 2012: Analysis and Trends
Celina, TX Real Estate Market Report 2013: Analysis and Trends
Celina, TX Real Estate Market Report 2014: Analysis and Trends
Celina, TX Real Estate Market Report 2015: Analysis and Trends
Celina, TX Real Estate Market Report 2016: Analysis and Trends
Celina, TX Real Estate Market Report 2017: Analysis and Trends
Celina, TX Real Estate Market Report 2018: Analysis and Trends
Celina, TX Real Estate Market Report 2019: Analysis and Trends
Celina, TX Real Estate Market Report 2020: Analysis and Trends
This market analysis is intended solely for educational purposes. This market analysis is based on data sourced from NTREIS, Inc. This analysis is exclusively focused on single-family homes and does not account for other property types. The total number of real estate transactions within the specified period and location may vary. Data accuracy cannot be guaranteed due to potential input errors made by NTREIS users. This market analysis does not account for all new construction home sales. If you need detailed information about recorded property sales or other public records, please contact the appropriate city or county office.

Celina, TX Real Estate: A Comprehensive Analysis of the 2020 Single-Family Residential Housing Market
The 2020 real estate market in Celina, Texas demonstrated resilience despite the global disruption caused by the first year of the COVID-19 pandemic. With an increase in overall sales, a steady rise in new construction, and slight growth in pricing metrics, the market adapted to shifting buyer preferences and economic realities. This analysis explores key trends, pricing patterns, and standout properties, offering a comprehensive view of the evolving market dynamics.
Key Takeaways and Trends from the 2020 Real Estate Market in Celina, TX
Pricing Range
The market exhibited a strong range of affordability, with home prices starting at $90,000 and reaching a maximum of $1,575,000. The median price of $382,250 reflects a balance of entry-level and premium properties.
Market Efficiency
Homes sold faster compared to previous years, with an average of just 77 DOM. This suggests stronger buyer activity, possibly due to lower interest rates and the desire for personal space during the pandemic.
Unique Outliers
The most expensive property showcased luxury features like a Zero Energy Readiness designation, private acreage, and unique amenities such as a barn and water well, underlining niche demands in the high-end sector.
Mortgage Rate Impact
Record-low mortgage rates, with the average 30-year fixed rate at 3.38%, boosted affordability for homebuyers. This resulted in heightened activity across multiple price brackets and continued demand for newly built homes.
Total Homes Closed
Celina experienced an impressive 1,248 home sales in 2020, a sharp increase compared to prior years. Of these, 751 were new construction homes, reflecting a 15.9% year-over-year growth in new builds. Additionally, 64 properties featured pools, satisfying the growing desire for in-home luxuries.
Property Pricing Insights
- Minimum Price: $90,000
- Maximum Price: $1,575,000
- Average Price: $409,484
- Median Price: $382,250
Though the average sales price saw growth, it remained balanced by a high volume of homes in the mid-range segment.
Property Size and Features
- Bedrooms: Properties ranged from 1 to 6 bedrooms, with an average of 4.
- Bathrooms: Homes included 1 to 11 bathrooms, with an average of 3.
- Square Footage: Size varied between 713 sq. ft. and 10,465 sq. ft., averaging 2,852 sq. ft.
- Lot Size: Covered from 0.014 to 25.65 acres, with the average lot at 0.366 acres.
Market Dynamics
- DOM: Homes spent an average of 77 days on the market, a noticeable improvement over 2019.
- Average ClsPr/LstPr: Properties sold for 97.71% of their listing price, indicating robust buyer demand and competitive market conditions.
- ClsPr/OLP: The close price against the original listing price averaged 96.22%.
- Price per Square Foot: The average price per square foot rose to $144.71, a 5.4% year-over-year increase, reflecting progressive value appreciation.
Insights into the Most Expensive Celina, TX Property Sold in 2020
The standout sale of 2020 was a custom-built home on a sprawling 21-acre lot, which sold for $1,575,000. Designed with zero-energy readiness and luxurious outdoor amenities, it epitomizes high-value property trends in Celina. Key metrics include:
- Price: $1,575,000
- Beds: 5
- Baths: 4
- Square Footage: 5,174 sq. ft.
- Price per Square Foot: $304.41
- Lot Size: 21.000 acres
- DOM: 226 days
- ClsPr/LstPr: 93.33%
- ClsPr/OLP: 84.00%
- Year Built: 2014
This property’s remarkable size, energy-efficient design, and sprawling acreage made it a stand-out sale. Despite slower movement in the luxury segment, its sale reflects demand for premium features and exclusivity, influencing upper-tier price expectations.
Economic context

Average Electricity Costs in Dallas-Fort Worth in 2020
Electricity prices returned to $0.13 per kilowatt-hour in 2020, slightly lower than 2019’s $0.14. This small decrease might have supported household budgets as the economy faced numerous uncertainties. Energy savings further highlighted the appeal of efficient homes, adding value to sustainable designs and energy-conscious upgrades.
Average Price for Regular Gasoline in Texas in 2020
Gas prices dipped to $1.82 per gallon in 2020, down significantly from $2.29 in 2019. Lower transportation costs provided financial relief to homebuyers, potentially boosting interest in suburban and rural areas where homes were larger and more affordable. The drop in gas prices gave buyers more flexibility in location choices.
Average 30-Year Fixed Mortgage Rate in 2020
Mortgage rates averaged just 3.38% in 2020, a steep drop from 4.13% the previous year. This marked an historic low, attracting a surge of homebuyers eager to lock in affordable financing. Pre-approval with local mortgage loan originators became an essential first step as buyers navigated increased competition in a hot market.
Curious about today’s mortgage rates and the home you can comfortably afford?
Submit a no-obligation mortgage application today and get pre-approved to determine your budget and take the first step toward homeownership with confidence.
Overview of Differences Between the 2020 and 2019 Real Estate Markets in Celina, Texas
Total Homes Sold
2019: 932
2020: 1,248
Home sales increased by 34%, reflecting heightened buyer activity fueled by low mortgage rates and shifting pandemic-driven preferences.
Number of Homes with Pools
2019: 47
2020: 64
Pool-equipped home sales rose by 36.2%, highlighting buyers’ increased preference for private outdoor amenities during the pandemic.
Number of New Construction Homes
2019: 648
2020: 751
New home sales reported a 15.9% increase, emphasizing the strong demand for modern properties during the year.
Average Sales Price
2019: $383,709
2020: $409,484
Average sales price grew by 6.7%, indicating stable price appreciation due to strong demand and limited supply in certain segments.
Average Days on Market (DOM)
2019: 101 days
2020: 77 days
Homes sold 24% faster in 2020, showcasing a more competitive market with quicker transactions.
Average Price Per Square Foot
2019: $137.24
2020: $144.71
A 5.4% increase in price per square foot suggests a steady rise in property valuations, possibly driven by increased interest in larger homes or modern upgrades.
Most Expensive Property Sold
2019: $1,220,000 (7 beds, 6 baths, 5,513 sq. ft., $221.30/sq. ft., 3.1 acres, 76 DOM)
2020: $1,575,000 (5 beds, 4 baths, 5,174 sq. ft., $304.41/sq. ft., 21 acres, 226 DOM)
The most expensive sale price increased by 29%, primarily due to larger acreage and higher price per square foot. However, the longer DOM suggests a narrower market for ultra-high-end properties.
Summary of Real Estate Market Analysis for Celina, TX in 2020
The 2020 real estate market in Celina, Texas demonstrated remarkable adaptability during a year of significant challenges, fueled by the impacts of the COVID-19 pandemic. The market’s robust performance—with an increase in homes sold, quicker sales cycles, and rising property values in key segments—is a testament to its resilience. This dynamic period created unique opportunities for both buyers and sellers, requiring strategic approaches from all participants.
Homebuyers and First-Time Homebuyers Perspective
For homebuyers, and especially first-time buyers, the low-interest-rate environment made 2020 a pivotal moment to enter or upgrade within the market. The historic drop in mortgage rates, coupled with growing inventory from new constructions, expanded options for budget-conscious and family-oriented buyers. However, increased competition required buyers to act quickly and strategically. Mortgage pre-approval was critical, enabling buyers to secure financing and strengthen their position in an active market. First-time homebuyers, in particular, benefited from careful planning and the availability of entry-level homes, which allowed them to achieve their homeownership dreams amidst favorable conditions.
Home-Sellers Perspective
For home sellers, the market offered significant advantages, particularly for those with updated or highly desirable properties. With days on market decreasing and close prices aligning closely with listing prices, sellers saw strong demand. Properties with features like added space, pools, and modern amenities were especially sought after, as buyers prioritized comfort and privacy during the pandemic. Still, strategic pricing remained essential to attract competitive offers and avoid prolonged market times, even in a highly active market.
Final Thoughts
The 2020 real estate market in Celina, TX reflected a year of resilience and transformation. Both buyers and sellers adapted to evolving circumstances, seizing opportunities presented by historically low mortgage rates and shifting buyer preferences. For buyers looking ahead, securing a mortgage pre-approval remains a key step in navigating a growing market efficiently and confidently. For sellers, understanding market trends and buyer priorities will remain essential as the market continues to evolve. With strong foundations and rising demand, Celina’s real estate market is well-positioned for continued growth and opportunity in the coming years.
Why Historical Statistical Data Matters in the Celina, Texas Real Estate Market
Did you know that Appraisers and Realtors rely on historical statistical data to determine a property’s current value?
The information presented above is just a small glimpse into the wealth of essential data available to help both homebuyers and sellers set realistic expectations and gain an initial understanding of the real estate market in Celina, Texas. Real estate transactions are intricate, and what you see here is merely a sample of the many factors at play in each deal in this city.
Beyond these insights, a comprehensive analysis is available that focuses on specific aspects like zip codes, neighborhoods, and homes within certain school districts in Celina. This granular data dives deeper into market trends, allowing for a precise understanding of local dynamics. Additionally, historical data plays a critical role in crafting informed strategies, providing the context needed to make confident decisions that align with your goals.
Unlock Exceptional Service!
Assistance with all your real estate needs in the Dallas-Fort Worth area is just a click or call away. Reach out at 214-940-8149 or connect through the links below.
Meet Your Trusted Realtor and Mortgage Expert in Celina, Texas!
Greetings! I’m Oleg Sedletsky, and I’m excited to introduce myself as your go-to full-time licensed Texas REALTOR® and Mortgage Loan Originator.
I proudly represent JPAR® – Real Estate Brokerage as a REALTOR® and Utopia Mortgage LLC as a Mortgage Loan Originator! My designations and certifications reflect my dedication to helping you achieve your real estate goals in CELINA, TX and other locations in the vibrant Dallas-Fort Worth area!
Whether you’re a homebuyer or a home seller, the information on this page highlights just a fraction of what’s important to know about the Celina, TX real estate market. Data like this is key to understanding trends, making informed decisions, and achieving your real estate goals.
The good news? I can provide much more. When you choose me as your real estate agent, you’ll gain access to detailed neighborhood analyses, historical trends, and everything you need to make confident decisions. Whether you’re buying your dream home or securing the best deal on a sale, I’ll guide you every step of the way with peace of mind.
I’d love to be your trusted advisor in this exciting journey. With a commitment to ongoing professional development, I’m always improving to serve you better. Plus, I’m fluent in English, Ukrainian, and Russian and ready to help whenever you’re ready.
If you’re looking for a dedicated, experienced professional, contact me today!
It’s All About You and Your Real Estate Goals!
My mission is to serve you! With my knowledge and expertise, I’m here to help you achieve all your real estate goals!
I’m passionate about helping homebuyers and home-sellers navigate the exciting real estate landscape in Celina, Texas! Whether you’re searching for your dream home, exploring land options, or looking for commercial properties, my Real Estate Services have you covered.
Contact me today for all your real estate needs in Celina, Texas! Call/text 214-940-8149
A Comprehensive Analysis of Single-Family Residential Housing Market in Celina, TX: 2010 to Present
Discover the trends, stats, and insights shaping Celina’s real estate market year by year!
2010-2020
Celina, TX Real Estate Market Report 2010: Analysis and Trends
Celina, TX Real Estate Market Report 2011: Analysis and Trends
Celina, TX Real Estate Market Report 2012: Analysis and Trends
Celina, TX Real Estate Market Report 2013: Analysis and Trends
Celina, TX Real Estate Market Report 2014: Analysis and Trends
Celina, TX Real Estate Market Report 2015: Analysis and Trends
Celina, TX Real Estate Market Report 2016: Analysis and Trends
Celina, TX Real Estate Market Report 2017: Analysis and Trends
Celina, TX Real Estate Market Report 2018: Analysis and Trends
Celina, TX Real Estate Market Report 2019: Analysis and Trends
Celina, TX Real Estate Market Report 2020: Analysis and Trends
This market analysis is intended solely for educational purposes. This market analysis is based on data sourced from NTREIS, Inc. This analysis is exclusively focused on single-family homes and does not account for other property types. The total number of real estate transactions within the specified period and location may vary. Data accuracy cannot be guaranteed due to potential input errors made by NTREIS users. This market analysis does not account for all new construction home sales. If you need detailed information about recorded property sales or other public records, please contact the appropriate city or county office.

Celina, TX Real Estate: A Comprehensive Analysis of the 2019 Single-Family Residential Housing Market
The 2019 real estate market in Celina, Texas experienced a dynamic year, characterized by rising sales volumes and longer average time on the market. New construction homes served as a key growth driver, while pricing trends demonstrated both resilience and steady value appreciation. This analysis provides a deeper look into property features, pricing patterns, and noteworthy outliers.
Key Takeaways and Trends from the 2019 Real Estate Market in Celina, TX
Pricing Range
Home prices ranged from $21,600 to $1,220,000, providing options for buyers across different budget categories. The median price of $365,000 reflected steady demand for mid-range homes.
Market Efficiency
An average ClsPr/LstPr ratio of 96.61% indicated overall market health and reasonable pricing expectations, although the slightly higher average DOM suggested a longer transaction process for some properties.
Unique Outliers
The most expensive property sold in 2019 exemplifies the allure of luxurious, custom-built estates designed for multi-generational living. However, the top sale price decreased compared to previous years, pointing to shifting dynamics in the luxury segment.
Mortgage Rate Impact
The average 30-year fixed mortgage rate dropped to 4.13% from 4.70% the previous year, providing buyers with more favorable financing options. This improvement likely boosted affordability and contributed to the increased sales volume seen in 2019.
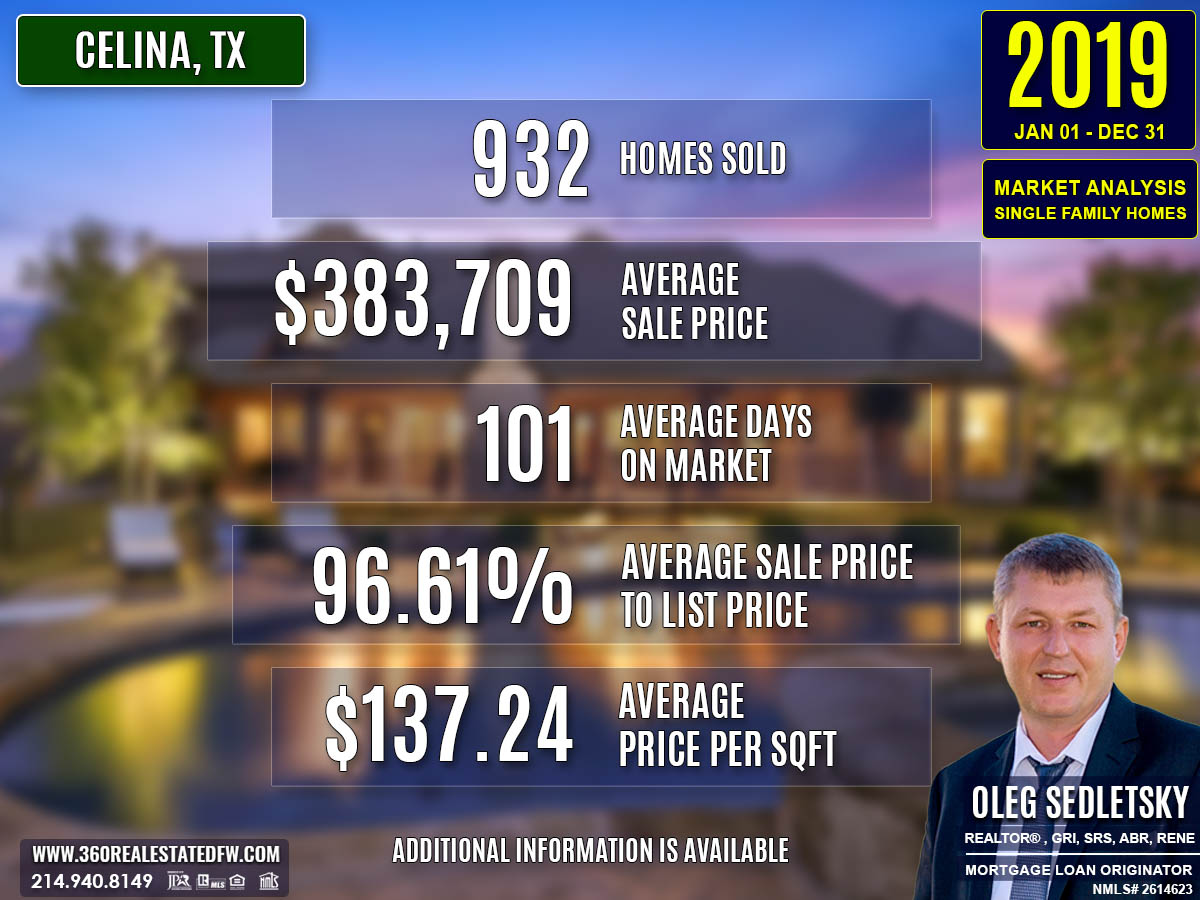
Total Homes Closed
A total of 932 residential single-family homes were sold in Celina, TX during 2019, marking a significant increase from the previous year. Out of these, 648 were new construction homes, reflecting strong development momentum. Additionally, 47 homes included pools, providing insight into the demand for lifestyle-enhancing amenities.
Property Pricing Insights
- Minimum Price: $21,600
- Maximum Price: $1,220,000
- Average Price: $383,709
- Median Price: $365,000
Prices in 2019 reflected a broad range, catering to both entry-level families and affluent buyers. The balance between average and median values indicated that mid-range homes continued to dominate the market.
Property Size and Features
- Average Beds: 4
- Average Baths: 3
- Average Square Footage: 2,824 sqft
- Average Lot Size: 0.321 acres
Most homes offered spacious layouts ideal for families. The variation in lot sizes highlights a mix of urban and suburban properties catering to diverse buyer preferences.
Market Dynamics
- Days on Market (DOM): 101 days on average, with a median of 80 days.
- Average ClsPr/LstPr Ratio: 96.61%, indicating pricing alignment to buyer expectations.
- Average ClsPr/OLP Ratio: 93.43%, reflecting some price adjustments over original listing prices to close deals.
- Average Price per Square Foot: $137.24, showing a slight increase from the prior year, indicating steady property appreciation.
Insights into the Most Expensive Celina, TX Property Sold in 2019
The most expensive home sold in 2019 was a stunning custom-built estate with luxury amenities. Below are the highlights:
- Price: $1,220,000
- Beds/Baths: 7 beds, 6 baths
- Square Footage: 5,513 sq. ft.
- Price Per Square Foot: $221.30
- Lot Size: 3.1 acres
- Days on Market (DOM): 76
- ClsPr/LstPr Ratio: 98.47%
- ClsPr/OLP Ratio: 93.92%
- Year Built: 1996
This property catered to high-end buyers with features such as a guest house ideal for multi-generational living, a pool, outdoor living spaces, and a storm shelter. While its closing price fell below the prior year’s top sale, it exemplifies the continued allure of luxury homes in Celina. The slightly quicker sale period of this high-value property also signifies efficient transaction dynamics in this segment.
Economic context
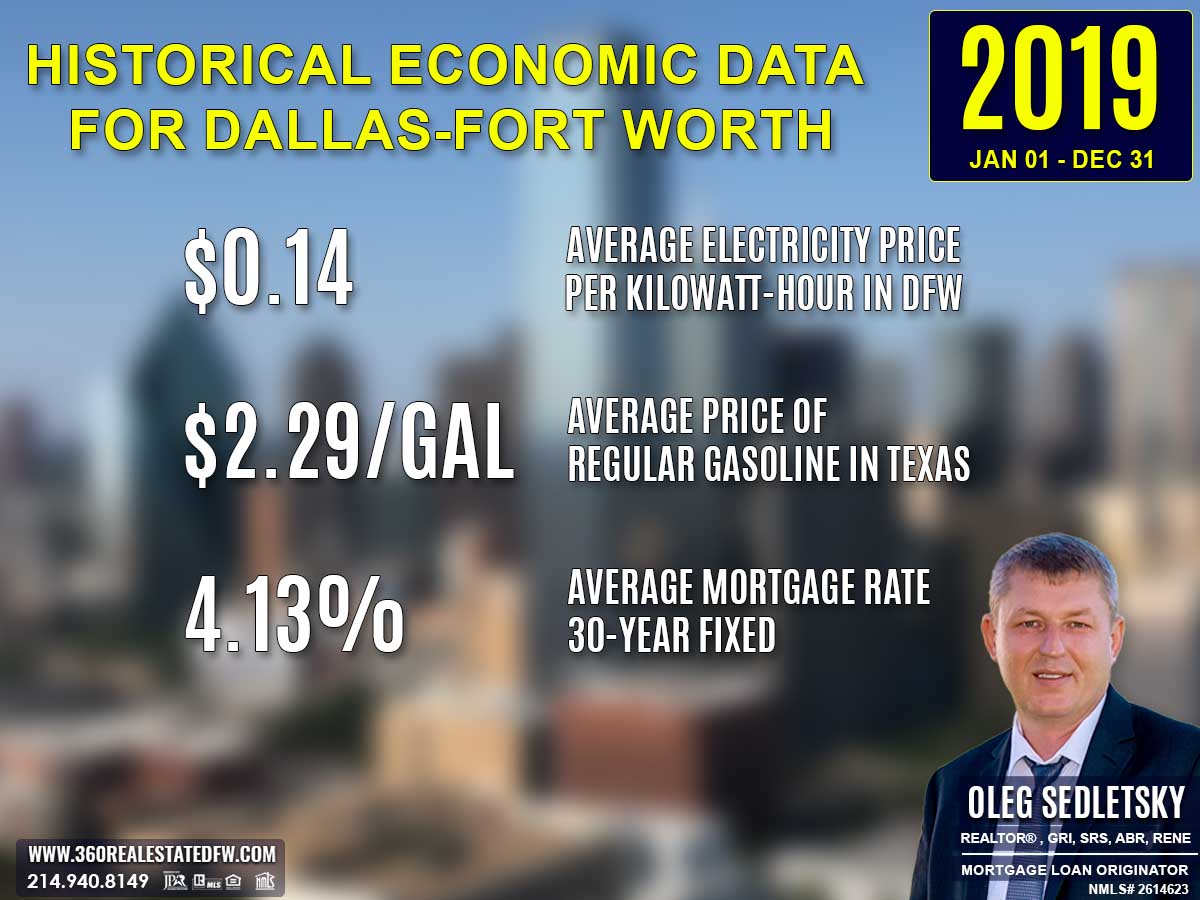
Average Electricity Costs in Dallas-Fort Worth in 2019
The average electricity price in 2019 climbed to $0.14 per kilowatt-hour, up from $0.13 in 2018. This uptick added some pressure on household budgets, further solidifying the need for energy-efficient homes. Properties featuring solar panels or smart home technologies likely gained value as homebuyers sought ways to mitigate rising energy expenses.
Average Price for Regular Gasoline in Texas in 2019
Gas prices fell slightly to $2.29 per gallon in 2019, down from $2.44 in 2018. This small decline brought modest relief to transportation costs and may have encouraged suburban home purchases, where commuting distances tend to be longer. Homebuyers likely balanced fuel costs with home prices when making location decisions.
Average 30-Year Fixed Mortgage Rate in 2019
Mortgage rates averaged 4.13% in 2019, down from 4.70% the year before. This noticeable decline made homeownership more attainable for many homebuyers and likely spurred activity in the housing market. Pre-approvals through local mortgage loan originators remained key for buyers wanting to confidently pursue homes amid favorable rate conditions.
Curious about today’s mortgage rates and the home you can comfortably afford?
Submit a no-obligation mortgage application today and get pre-approved to determine your budget and take the first step toward homeownership with confidence.
Overview of Differences Between the 2019 and 2018 Real Estate Markets in Celina, Texas
Total Homes Sold
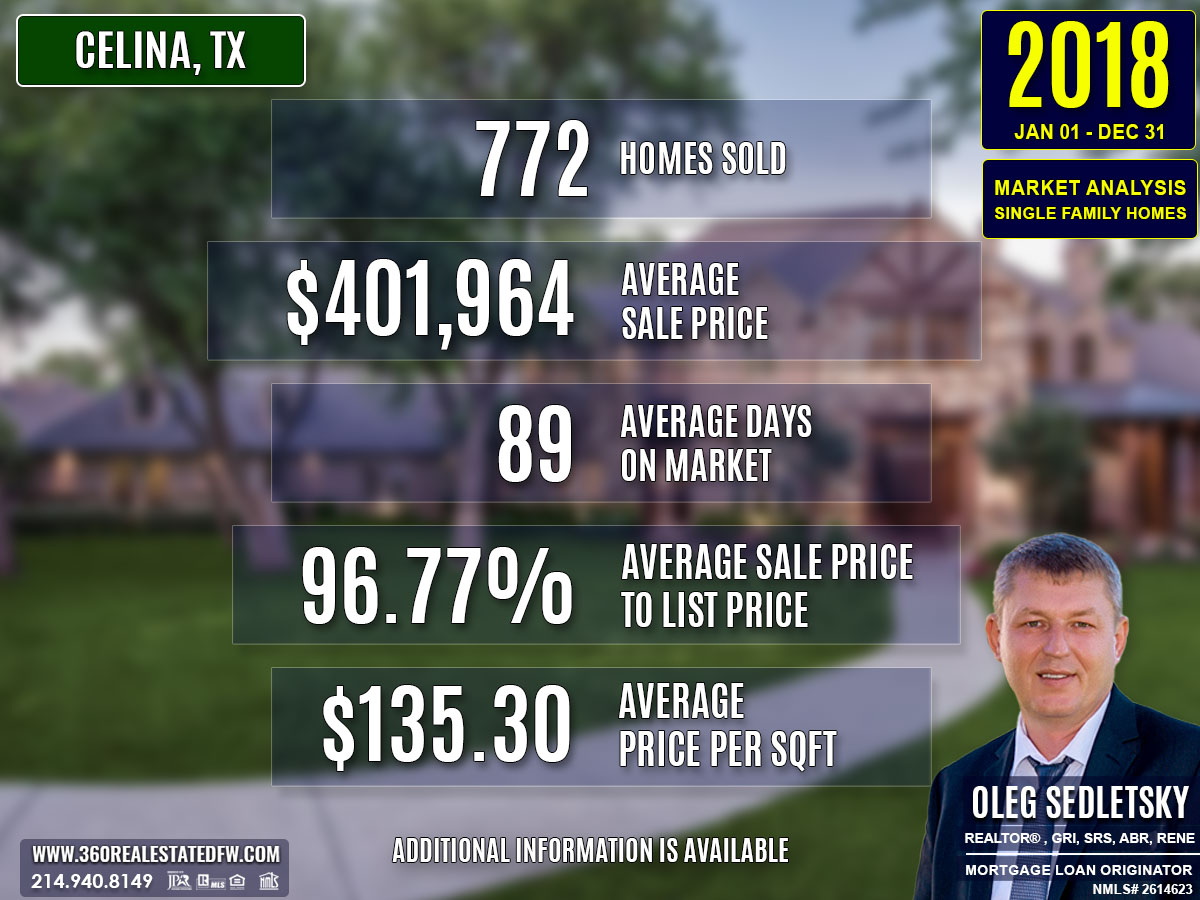
2018: 772
2019: 932
Home sales increased by 20.7%, driven by stronger buyer interest and a significant rise in new construction activities.
Number of Homes with Pools
2018: 45
2019: 47
Pool home sales rose slightly by 4.4%, highlighting niche but persistent demand for properties with luxury features.
Number of New Construction Homes
2018: 507
2019: 648
New construction home sales surged by 27.8%, showcasing robust development across Celina to meet increasing demand.
Average Sales Price
2018: $401,964
2019: $383,709
The average sales price declined by 4.5%, reflecting a shift in market dynamics toward affordability or a broader range of entry-level options.
Average Days on Market (DOM)
2018: 89 days
2019: 101 days
Homes took 13.5% longer to sell on average, indicating a slightly slower market pace or more inventory to choose from.
Average Price Per Square Foot
2018: $135.30
2019: $137.24
The price per square foot saw a modest 1.4% increase, showing steady value growth despite the dip in average sales price.
Most Expensive Property Sold
2018: $2,000,000 (5,614 sq. ft., $356.25/sq. ft.)
2019: $1,220,000 (5,513 sq. ft., $221.30/sq. ft.)
The top-end property sale price dropped by 39%, indicating tempered activity in the luxury market segment, reflected in both the lower total price and price per square foot.
Summary of Real Estate Market Analysis for Celina, TX in 2019
The 2019 real estate market in Celina, TX exhibited significant growth in transaction volume, marked by a rise in closed sales and a strong influence of new construction homes. While pricing trends revealed slight adjustments, the market maintained healthy dynamics with a steady appreciation in price per square foot. This conclusion will explore perspectives for homebuyers, including first-time buyers, and home sellers, wrapping up with final reflections on the market’s future trajectory.
Homebuyers and First-Time Homebuyers Perspective
For homebuyers, 2019 provided numerous opportunities, such as a wide pricing range and an influx of new construction homes with modern features. The wide pricing range—from entry-level homes to luxury estates—offered options for various budgets. First-time homebuyers especially benefited from the availability of affordable new construction properties. However, the average sales price and rising price per square foot highlighted the need for financial readiness. Securing mortgage pre-approval was critical for buyers to strengthen their offers.
Home-Sellers Perspective
Home-sellers in Celina benefited from a growing market with increased buyer interest. Properties priced strategically and reflective of their value achieved solid ClsPr/LstPr ratios, underscoring the importance of accurate pricing. New construction sellers saw particular success in 2019, leveraging modern designs and amenities. However, with certain properties lingering longer on the market, sellers were reminded of the importance of marketing efforts, pricing flexibility, and property readiness to appeal to potential buyers.
Final Thoughts
The 2019 real estate market in Celina, TX demonstrated resilience and growth, driven by steady development and active participation from both buyers and sellers. For homebuyers and sellers alike, adapting to market conditions and leveraging strategic tools like mortgage pre-approval or accurate pricing proved critical to their success. Looking ahead, the strong performance metrics signal continued opportunities in Celina’s real estate scene for those who stay informed and prepared for the market’s shifts.
Why Historical Statistical Data Matters in the Celina, Texas Real Estate Market
Did you know that Appraisers and Realtors rely on historical statistical data to determine a property’s current value?
The information presented above is just a small glimpse into the wealth of essential data available to help both homebuyers and sellers set realistic expectations and gain an initial understanding of the real estate market in Celina, Texas. Real estate transactions are intricate, and what you see here is merely a sample of the many factors at play in each deal in this city.
Beyond these insights, a comprehensive analysis is available that focuses on specific aspects like zip codes, neighborhoods, and homes within certain school districts in Celina. This granular data dives deeper into market trends, allowing for a precise understanding of local dynamics. Additionally, historical data plays a critical role in crafting informed strategies, providing the context needed to make confident decisions that align with your goals.
Unlock Exceptional Service!
Assistance with all your real estate needs in the Dallas-Fort Worth area is just a click or call away. Reach out at 214-940-8149 or connect through the links below.
Meet Your Trusted Realtor and Mortgage Expert in Celina, Texas!
Greetings! I’m Oleg Sedletsky, and I’m excited to introduce myself as your go-to full-time licensed Texas REALTOR® and Mortgage Loan Originator.
I proudly represent JPAR® – Real Estate Brokerage as a REALTOR® and Utopia Mortgage LLC as a Mortgage Loan Originator! My designations and certifications reflect my dedication to helping you achieve your real estate goals in CELINA, TX and other locations in the vibrant Dallas-Fort Worth area!
Whether you’re a homebuyer or a home seller, the information on this page highlights just a fraction of what’s important to know about the Celina, TX real estate market. Data like this is key to understanding trends, making informed decisions, and achieving your real estate goals.
The good news? I can provide much more. When you choose me as your real estate agent, you’ll gain access to detailed neighborhood analyses, historical trends, and everything you need to make confident decisions. Whether you’re buying your dream home or securing the best deal on a sale, I’ll guide you every step of the way with peace of mind.
I’d love to be your trusted advisor in this exciting journey. With a commitment to ongoing professional development, I’m always improving to serve you better. Plus, I’m fluent in English, Ukrainian, and Russian and ready to help whenever you’re ready.
If you’re looking for a dedicated, experienced professional, contact me today!
It’s All About You and Your Real Estate Goals!
My mission is to serve you! With my knowledge and expertise, I’m here to help you achieve all your real estate goals!
I’m passionate about helping homebuyers and home-sellers navigate the exciting real estate landscape in Celina, Texas! Whether you’re searching for your dream home, exploring land options, or looking for commercial properties, my Real Estate Services have you covered.
Contact me today for all your real estate needs in Celina, Texas! Call/text 214-940-8149
A Comprehensive Analysis of Single-Family Residential Housing Market in Celina, TX: 2010 to Present
Discover the trends, stats, and insights shaping Celina’s real estate market year by year!
2010-2020
Celina, TX Real Estate Market Report 2010: Analysis and Trends
Celina, TX Real Estate Market Report 2011: Analysis and Trends
Celina, TX Real Estate Market Report 2012: Analysis and Trends
Celina, TX Real Estate Market Report 2013: Analysis and Trends
Celina, TX Real Estate Market Report 2014: Analysis and Trends
Celina, TX Real Estate Market Report 2015: Analysis and Trends
Celina, TX Real Estate Market Report 2016: Analysis and Trends
Celina, TX Real Estate Market Report 2017: Analysis and Trends
Celina, TX Real Estate Market Report 2018: Analysis and Trends
Celina, TX Real Estate Market Report 2019: Analysis and Trends
Celina, TX Real Estate Market Report 2020: Analysis and Trends
This market analysis is intended solely for educational purposes. This market analysis is based on data sourced from NTREIS, Inc. This analysis is exclusively focused on single-family homes and does not account for other property types. The total number of real estate transactions within the specified period and location may vary. Data accuracy cannot be guaranteed due to potential input errors made by NTREIS users. This market analysis does not account for all new construction home sales. If you need detailed information about recorded property sales or other public records, please contact the appropriate city or county office.

Celina, TX Real Estate: A Comprehensive Analysis of the 2018 Single-Family Residential Housing Market
The 2018 real estate market in Celina, Texas reflected a bustling and competitive landscape, with notable growth in new construction sales and steady demand for properties with premium features like pools. This analysis explores metrics that highlight market pricing, efficiency, and the impact of fluctuating mortgage rates.
Key Takeaways and Trends from the 2018 Real Estate Market in Celina, TX
Pricing Range
Property prices ranged from $90,000 to $2,000,000, and a broader selection of mid- to high-end homes entered the market.
Market Efficiency
The close price-to-listing price ratio averaged at 96.77%, indicating strong competition, while homes spent slightly more time on the market (89 days on average).
Unique Outliers
A notable outlier was the sale of a $2,000,000 estate distinguished by its expansive acreage and premium amenities. This property offered valuable insight into the preferences and motivations of high-end buyers.
Mortgage Rate Impact
With the average 30-year fixed mortgage rate rising to 4.70%, affordability pressures may have played a role in driving demand for more competitively priced homes.
Total Homes Closed
A total of 772 homes closed during 2018, reflecting a marked growth in sales. New construction homes accounted for a significant portion, with 507 properties, highlighting strong development activity. Additionally, 45 homes with pools sold, showcasing persistent demand for luxury amenities.
Property Pricing Insights
- Minimum Price: $90,000
- Maximum Price: $2,000,000
- Average Price: $401,964
- Median Price: $375,462
The median price reflects a balanced market where most homes fell into the mid-range pricing category, despite high-end outliers.
Property Size and Features
Bedrooms
- Average: 4 bedrooms
- Median: 4 bedrooms
- Range: 2 to 6 bedrooms
Bathrooms
- Average: 3 bathrooms
- Median: 3 bathrooms
- Range: 1 to 8 bathrooms
Square Footage
- Average: 2,981 sqft
- Median: 2,948 sqft
- Range: 713 sqft to 6,811 sqft
Lot Size
- Average: 0.457 acres
- Median: 0.16 acres
- Range: 0.14 acres to 24.495 acres
Market Dynamics
- Average Days on Market (DOM): Homes stayed on the market for an average of 89 days, with some properties experiencing significantly longer listings.
- Close Price to Listing Price (ClsPr/LstPr): Homes sold, on average, for 96.77% of their listing price, demonstrating robust buyer activity and market confidence.
- Average Close Price to Original Listing Price (ClsPr/OLP): The ratio stood at 94.98%, indicating that sellers adjusted expectations in response to market conditions.
- Average Price Per Square Foot: Prices averaged at $135.30 per sqft, signaling a slight but consistent property value appreciation.
Insights into the Most Expensive Celina, TX Property Sold in 2018
The 2018 market’s standout property was a country estate sold for $2,000,000. Situated on a sprawling 18-acre lot, it offered luxury and privacy with unique amenities such as two large ponds, a deep water well, and breathtaking views. Highlights of this property include:
- Price: $2,000,000
- Bedrooms: 4
- Bathrooms: 5 (4 full, 1 half)
- Square Footage: 5,614 sqft
- Price per Square Foot: $356.25/sqft
- Lot Size: 18.091 acres
- Days on Market: 207 days
- ClsPr/LstPr: 81.63%
- ClsPr/OLP: 81.63%
- Year Built: 2005
This estate’s extended time on the market and lower close-to-list ratio reflect the niche demand for ultra-luxury rural properties, which generally attract a smaller buyer pool. However, its eventual sale underscores the potential for high-net-worth transactions in Celina’s evolving market.
Economic context
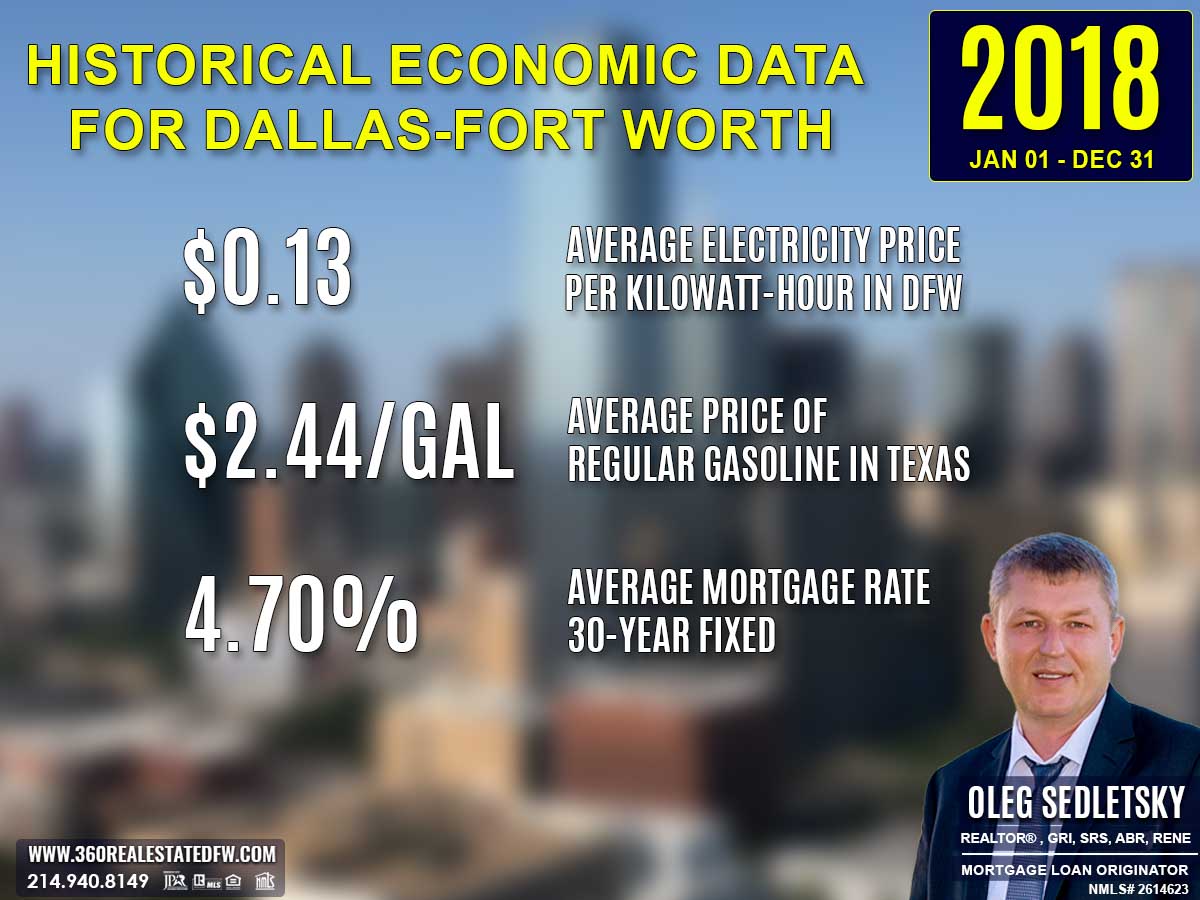
Average Electricity Costs in Dallas-Fort Worth in 2018
Electricity prices increased to $0.13 per kilowatt-hour in 2018, compared to $0.12 in 2017. This climb likely drove demand for energy-efficient housing and renovations, placing greater emphasis on properties with modern upgrades that helped households manage increasing utility costs.
Average Price for Regular Gasoline in Texas in 2018
Gas prices also rose, reaching $2.44 per gallon in 2018, up from $2.19 in 2017. With transportation becoming more expensive, proximity to workplaces and public transportation remained important for homebuyers. Walkable neighborhoods and mixed-use developments gained traction during this period.
Average 30-Year Fixed Mortgage Rate in 2018
Mortgage rates climbed to 4.70% in 2018, from 4.14% in the previous year. For many homebuyers, this level of interest rate signaled urgency to act before rates increased further. Getting pre-approved by a local mortgage loan originator was pivotal for navigating the pressures of a market increasingly shaped by rising rates.
Curious about today’s mortgage rates and the home you can comfortably afford?
Submit a no-obligation mortgage application today and get pre-approved to determine your budget and take the first step toward homeownership with confidence.
Overview of Differences Between the 2018 and 2017 Real Estate Markets in Celina, Texas
Total Homes Sold
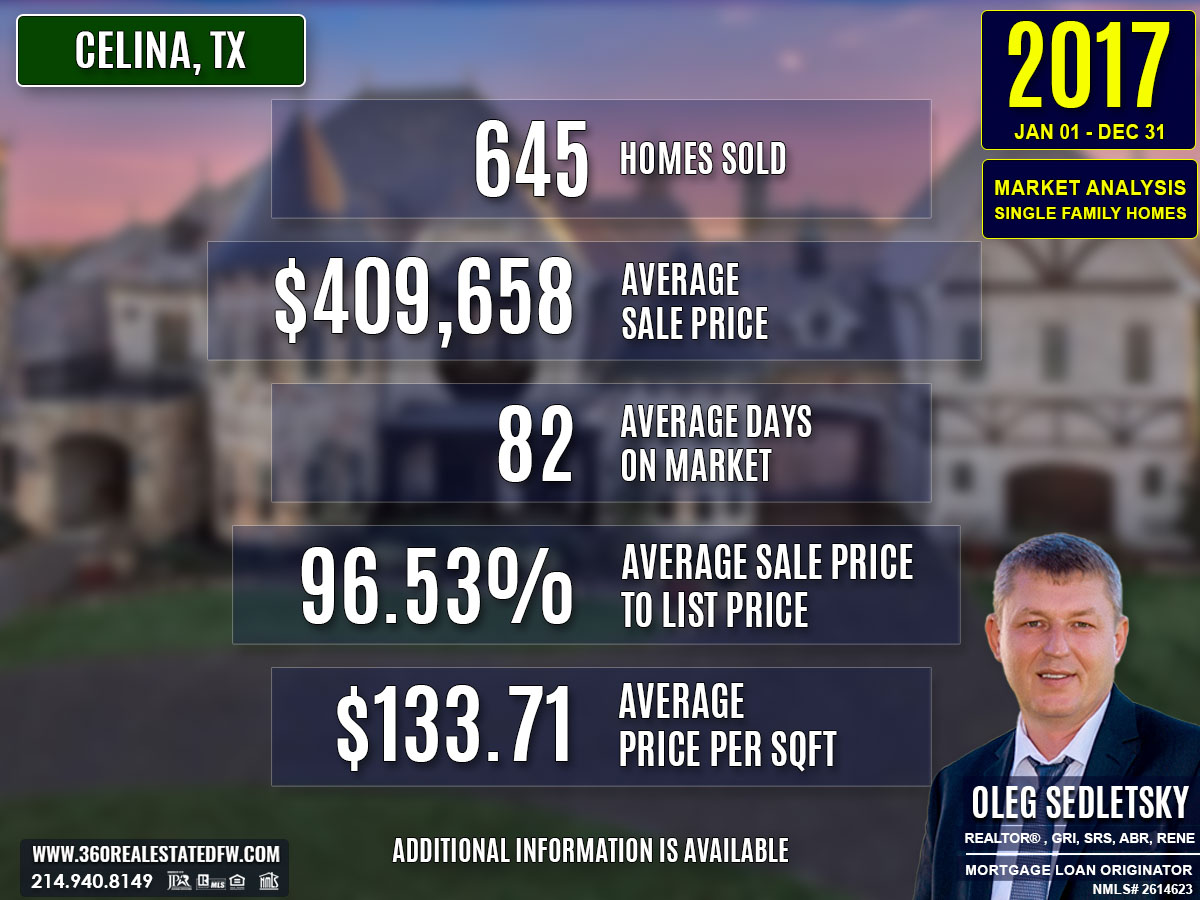
2017: 645
2018: 772
Home sales increased by approximately 19.7%, reflecting stronger market activity and demand in 2018.
Number of Homes with Pools
2017: 49
2018: 45
Sales of homes with pools decreased by about 8.2%, suggesting a shift in buyer preferences or reduced inventory of pool-equipped properties.
Number of New Construction Homes
2017: 386
2018: 507
New construction home sales surged by 31.3%, showcasing strong development activity and buyer interest in modern features.
Average Sales Price
2017: $409,658
2018: $401,964
The average sales price slightly decreased by 1.9%, suggesting that more buyers opted for properties in mid-range price points despite rising interest rates.
Average Days on Market (DOM)
2017: 82 days
2018: 89 days
Homes stayed on the market seven days longer on average in 2018, indicating a more measured pace for transactions.
Average Price Per Square Foot
2017: $133.71
2018: $135.30
The price per square foot rose slightly by 1.2%, reflecting steady property value appreciation despite a marginal dip in average sales prices.
Most Expensive Property Sold
2017: $2,979,900
2018: $2,000,000
The most expensive property sold in 2018 was $979,900 (32.9%) less expensive than in 2017. While the 2017 high-end sale showcased a sprawling 69-acre ranch, the 2018 property offered a smaller 18-acre luxury estate, indicating a tempered luxury market segment.
Summary of Real Estate Market Analysis for Celina, TX in 2018
The 2018 Celina, Texas real estate market was a dynamic and eventful year, characterized by a notable increase in closed sales, robust new construction activity, and steady appreciation in property values. With rising mortgage rates and a diverse range of property options available, the market presented unique opportunities and challenges for buyers and sellers alike.
Homebuyers and First-Time Homebuyers Perspective
For homebuyers, 2018 offered a range of options from competitively priced homes to luxury properties in expansive lots. While the average sales price and mortgage rates were on the rise, the availability of new construction homes presented an appealing opportunity for those seeking modern features. First-time homebuyers faced hurdles with affordability, as rising interest rates tightened budgets. For these buyers, mortgage pre-approval proved essential in improving their purchasing power and competing effectively in a busy market. By being pre-approved, buyers gained a clear understanding of their financial boundaries, streamlining the home search process.
Home-Sellers Perspective
Home-sellers benefited significantly in 2018, with a 96.77% close price-to-list price ratio showcasing strong buyer demand. The growing interest in new construction and homes with value-added amenities like pools highlighted the market’s willingness to invest in unique properties. However, strategic pricing was crucial, especially for high-end homes and niche markets, where extended days on market could affect the property’s perceived value. Sellers who partnered with knowledgeable realtors in Celina and adopted competitive pricing and marketing strategies were able to capitalize on the year’s upward trends effectively.
Final Thoughts
The 2018 real estate market in Celina, TX was a reflection of growth, resilience, and opportunity. While homebuyers contended with rising property values and interest rates, mortgage pre-approval empowered them to make informed decisions. For sellers, the year presented numerous advantages, particularly for those who understood the importance of pricing accurately to attract motivated buyers. Looking ahead, Celina’s evolving landscape and sustained buyer interest indicate a promising future for both buyers and sellers who adapt strategically to the market’s dynamics.
Why Historical Statistical Data Matters in the Celina, Texas Real Estate Market
Did you know that Appraisers and Realtors rely on historical statistical data to determine a property’s current value?
The information presented above is just a small glimpse into the wealth of essential data available to help both homebuyers and sellers set realistic expectations and gain an initial understanding of the real estate market in Celina, Texas. Real estate transactions are intricate, and what you see here is merely a sample of the many factors at play in each deal in this city.
Beyond these insights, a comprehensive analysis is available that focuses on specific aspects like zip codes, neighborhoods, and homes within certain school districts in Celina. This granular data dives deeper into market trends, allowing for a precise understanding of local dynamics. Additionally, historical data plays a critical role in crafting informed strategies, providing the context needed to make confident decisions that align with your goals.
Unlock Exceptional Service!
Assistance with all your real estate needs in the Dallas-Fort Worth area is just a click or call away. Reach out at 214-940-8149 or connect through the links below.
Meet Your Trusted Realtor and Mortgage Expert in Celina, Texas!
Greetings! I’m Oleg Sedletsky, and I’m excited to introduce myself as your go-to full-time licensed Texas REALTOR® and Mortgage Loan Originator.
I proudly represent JPAR® – Real Estate Brokerage as a REALTOR® and Utopia Mortgage LLC as a Mortgage Loan Originator! My designations and certifications reflect my dedication to helping you achieve your real estate goals in CELINA, TX and other locations in the vibrant Dallas-Fort Worth area!
Whether you’re a homebuyer or a home seller, the information on this page highlights just a fraction of what’s important to know about the Celina, TX real estate market. Data like this is key to understanding trends, making informed decisions, and achieving your real estate goals.
The good news? I can provide much more. When you choose me as your real estate agent, you’ll gain access to detailed neighborhood analyses, historical trends, and everything you need to make confident decisions. Whether you’re buying your dream home or securing the best deal on a sale, I’ll guide you every step of the way with peace of mind.
I’d love to be your trusted advisor in this exciting journey. With a commitment to ongoing professional development, I’m always improving to serve you better. Plus, I’m fluent in English, Ukrainian, and Russian and ready to help whenever you’re ready.
If you’re looking for a dedicated, experienced professional, contact me today!
It’s All About You and Your Real Estate Goals!
My mission is to serve you! With my knowledge and expertise, I’m here to help you achieve all your real estate goals!
I’m passionate about helping homebuyers and home-sellers navigate the exciting real estate landscape in Celina, Texas! Whether you’re searching for your dream home, exploring land options, or looking for commercial properties, my Real Estate Services have you covered.
Contact me today for all your real estate needs in Celina, Texas! Call/text 214-940-8149
A Comprehensive Analysis of Single-Family Residential Housing Market in Celina, TX: 2010 to Present
Discover the trends, stats, and insights shaping Celina’s real estate market year by year!
2010-2020
Celina, TX Real Estate Market Report 2010: Analysis and Trends
Celina, TX Real Estate Market Report 2011: Analysis and Trends
Celina, TX Real Estate Market Report 2012: Analysis and Trends
Celina, TX Real Estate Market Report 2013: Analysis and Trends
Celina, TX Real Estate Market Report 2014: Analysis and Trends
Celina, TX Real Estate Market Report 2015: Analysis and Trends
Celina, TX Real Estate Market Report 2016: Analysis and Trends
Celina, TX Real Estate Market Report 2017: Analysis and Trends
Celina, TX Real Estate Market Report 2018: Analysis and Trends
Celina, TX Real Estate Market Report 2019: Analysis and Trends
Celina, TX Real Estate Market Report 2020: Analysis and Trends
This market analysis is intended solely for educational purposes. This market analysis is based on data sourced from NTREIS, Inc. This analysis is exclusively focused on single-family homes and does not account for other property types. The total number of real estate transactions within the specified period and location may vary. Data accuracy cannot be guaranteed due to potential input errors made by NTREIS users. This market analysis does not account for all new construction home sales. If you need detailed information about recorded property sales or other public records, please contact the appropriate city or county office.

Celina, TX Real Estate: A Comprehensive Analysis of the 2017 Single-Family Residential Housing Market
The Celina, Texas real estate market in 2017 showcased an impressive surge in activity, underlined by a significant rise in homes sold as well as notable shifts in pricing and property dynamics. This analysis explores the year’s pivotal trends, offering in-depth insights into property prices, key features, and market dynamics.
Key Takeaways and Trends from the 2017 Real Estate Market in Celina, TX
Pricing Range
Property prices in 2017 ranged from as low as $63,000 to a staggering $2,979,900, reflecting a broad spectrum of affordability and luxury. This diversity ensures that buyers across varying budgets could find their ideal homes, driving the increased transaction volume.
Market Efficiency
Despite an average of 82 days on the market, the close price to listing price ratio of 96.53% signals an efficient market, where homes were priced competitively and sold close to their asking price.
Unique Outliers
The most expensive property, sold for nearly $3 million, not only commanded a high price but also set benchmarks for luxury living, with unparalleled features such as multi-generational quarters, private lakes, and expansive acreage.
Mortgage Rate Impact
With the 30-year fixed mortgage rate rising to 4.14% from the previous year’s 3.79%, buyers demonstrated resilience, fueling transactions despite slightly higher borrowing costs.
Total Homes Closed
A total of 645 residential single-family properties closed in Celina, TX during 2017, showcasing a 55% increase compared to the 416 homes sold in 2016.
- New Construction Homes: 386, indicating strong developer activity and a preference among buyers for modern construction.
- Homes with Pools: 49, reflecting an uptick in demand for homes featuring leisure-oriented amenities.
Property Pricing Insights
- Minimum Price: $63,000
- Maximum Price: $2,979,900
- Average Price: $409,658
- Median Price: $377,000
The substantial jump in average sales price is indicative of not only market appreciation but also an increased composition of upscale properties in the sales mix.
Property Size and Features
- Bedrooms: The average home offered 4 bedrooms, with larger options catering to diverse family sizes.
- Bathrooms: An average of 3 bathrooms provided ample space and comfort for modern households.
- Square Footage: Homes averaged 3,061 sqft, maintaining a balance between livability and luxury.
- Lot Size: At an average of 0.732 acres, properties provided a variety of outdoor spaces, catering to both urban and suburban preferences.
Market Dynamics
- Days on Market (DOM): Averaged 82 days, signaling a moderately paced environment for sellers.
- Average ClsPr/LstPr (Close Price to Listing Price): 96.53%, reinforcing effective pricing strategies and strong buyer interest.
- Average ClsPr/OLP (Close Price to Original Listing Price): 94.19%, suggesting occasional price corrections but overall market stability.
- Average Price per Square Foot: $133.71, showcasing incremental appreciation in property values and buyer willingness to pay more for quality construction.
Insights into the Most Expensive Celina, TX Property Sold in 2017
A standout transaction in 2017 involved a spectacular estate sold for $2,979,900. This trophy property set new standards for luxury living in Celina and included remarkable features that justified its price point. Below are the key details:
- Price: $2,979,900
- Beds: 4
- Baths: 7 (5 full, 2 half)
- Square Footage: 7,334 sqft
- Price per Square Foot: $406.31
- Lot Size: 69.8 acres
- Days on Market (DOM): 104 days
- ClsPr/LstPr (Close Price to Listing Price): 99.33%
- ClsPr/OLP (Close Price to Original Listing Price): 90.99%
- Year Built: 2005
This sprawling ranch property, boasting private lakes, multi-generational accommodations, resort-style amenities, and unparalleled privacy, underscored the potential for large-scale, luxury living in Celina. While its extended time on the market compared to other homes highlights the unique buyer niche for such properties, its close-to-list price sale reflects an appetite for premium estates.
Economic context
Average Electricity Costs in Dallas-Fort Worth in 2017
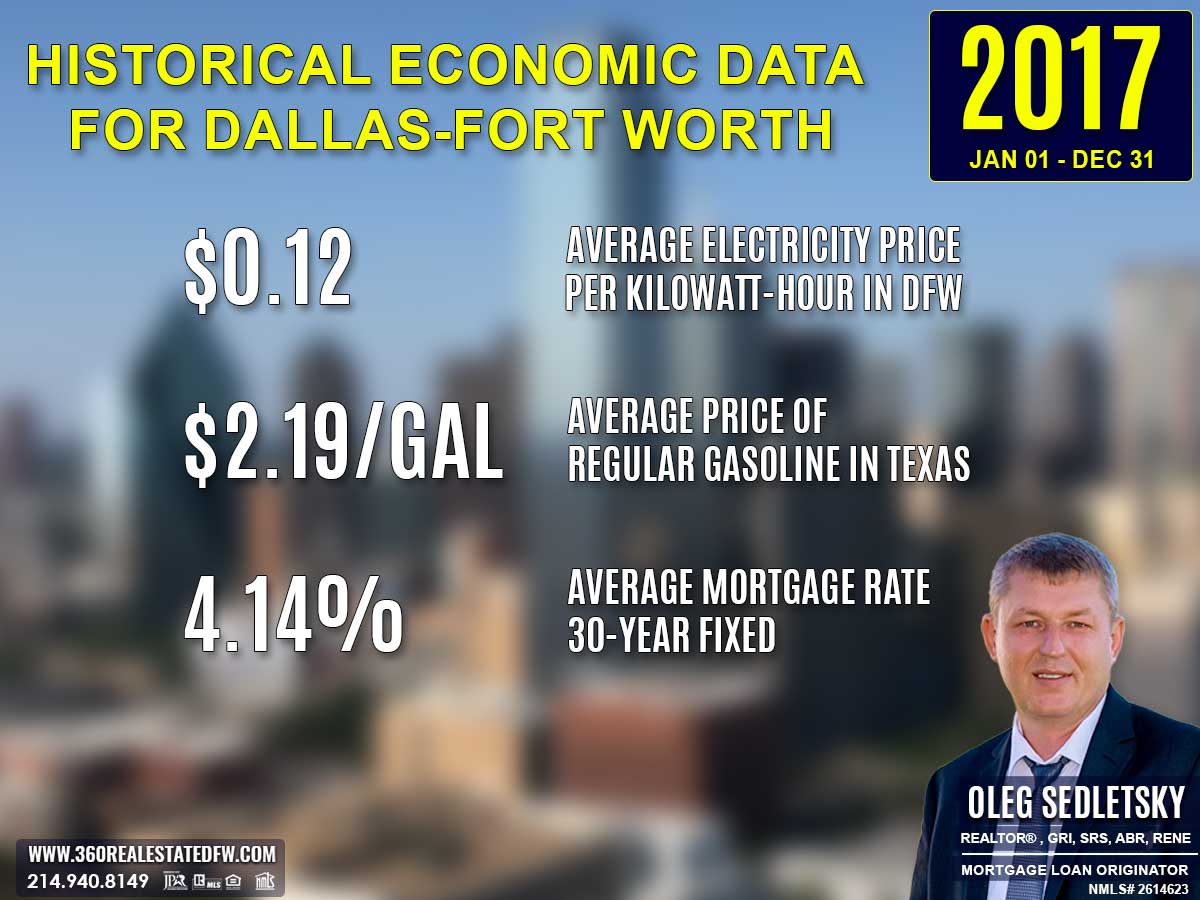
Electricity prices rose to $0.12 per kilowatt-hour in 2017, after a year at $0.11. This small uptick likely reignited interest in smaller homes or energy-efficient features. homebuyers remained cautious about properties with older energy systems, viewing them as less desirable long-term investments.
Average Price for Regular Gasoline in Texas in 2017
Gas prices increased to $2.19 per gallon in 2017, up from $1.91 in 2016. While still relatively affordable, the rise may have led homebuyers to reconsider the financial trade-offs of suburban living. Proximity to public transportation hubs became a more significant factor during housing searches.
Average 30-Year Fixed Mortgage Rate in 2017
Mortgage rates rose to 4.14% in 2017, up from 3.79% the year prior. The return of higher rates reminded homebuyers of the importance of locking in favorable financing terms early. Pre-approval through local mortgage loan originators remained vital to navigating the shifting landscape effectively and with confidence.
Curious about today’s mortgage rates and the home you can comfortably afford?
Submit a no-obligation mortgage application today and get pre-approved to determine your budget and take the first step toward homeownership with confidence.
Overview of Differences Between the 2017 and 2016 Real Estate Markets in Celina, Texas
Total Homes Sold
2016: 416
2017: 645
The total homes sold increased by 55%, indicating a significant rise in buyer demand and overall market activity in 2017.
Average Sales Price
2016: $378,897
2017: $409,658
The average sales price increased by 8.1%, reflecting market appreciation and a higher volume of higher-priced properties being sold.
Average Days on Market (DOM)
2016: 58 days
2017: 82 days
Homes spent, on average, 41% more time on the market in 2017, which may suggest a slightly slower turnover despite higher sales volume, potentially due to a larger inventory.
Average Price per Square Foot
2016: $129.25
2017: $133.71
A 3.5% increase in the average price per square foot highlights continued appreciation in property values.
Number of Homes with Pools
2016: 39
2017: 49
10 more homes with pools were sold in 2017, representing a 25.6% increase. This indicates steady demand for properties with premium amenities.
Number of New Construction Homes
2016: 221
2017: 386
New construction sales grew by 74.7%, suggesting substantial development activity and a strong preference for recently built homes.
Most Expensive Property Sold
2016: $2,142,600 (5 beds, 6 baths, 9,057 sqft, $236.57/sqft, 3.01-acre lot)
2017: $2,979,900 (4 beds, 7 baths, 7,334 sqft, $406.31/sqft, 69.8-acre lot)
The most expensive property in 2017 was sold for 39.1% more than in 2016, emphasizing the growing high-end market segment. This property also featured significantly more acreage and luxury features, justifying its premium price.
Summary of Real Estate Market Analysis for Celina, TX in 2017
The 2017 Celina, Texas real estate market marked a year of remarkable growth and activity. With a 55% increase in closed transactions compared to the previous year, it was clear that both supply and demand were thriving. The market provided opportunities for a wide range of buyers and sellers, from entry-level homes to luxury estates, supported by a robust inventory and rising property values. The involvement of experienced realtors played a pivotal role in navigating this dynamic environment effectively.
Homebuyers and First-Time Homebuyers Perspective
For homebuyers, particularly first-time buyers, 2017 offered a variety of opportunities but also posed challenges. Rising home prices and mortgage rates tested budgets, especially for those entering the market for the first time. However, the diverse selection of properties, including new construction and homes with modern amenities, created appealing choices for many buyers. First-time homebuyers who prioritized mortgage pre-approval and worked closely with knowledgeable realtors were better positioned to act quickly and confidently, ensuring they made sound decisions in a competitive market.
Home-Sellers Perspective
For home-sellers, 2017 proved to be an advantageous year, with rising home prices and strong buyer demand. Homes sold at an average of 96.53% of their listing price, underscoring the effective pricing strategies and the desirability of properties in Celina. Sellers who aligned with experienced realtors benefited greatly from expert marketing advice and strategies that showcased their homes’ unique features. The growth in new construction and the inclusion of homes with luxury amenities like pools gave sellers the opportunity to captivate buyers searching for high-quality options.
Final Thoughts
The 2017 real estate market in Celina, TX highlighted the importance of being prepared and well-informed for both buyers and sellers. Buyers needed to adapt to rising costs by securing pre-approval and working with trusted realtors to find the best opportunities, while sellers leveraged a growing market with the help of experienced professionals to optimize their sales. Looking forward, the trends of growth and modernization signal a promising future for the Celina real estate market for all participants.
Why Historical Statistical Data Matters in the Celina, Texas Real Estate Market
Did you know that Appraisers and Realtors rely on historical statistical data to determine a property’s current value?
The information presented above is just a small glimpse into the wealth of essential data available to help both homebuyers and sellers set realistic expectations and gain an initial understanding of the real estate market in Celina, Texas. Real estate transactions are intricate, and what you see here is merely a sample of the many factors at play in each deal in this city.
Beyond these insights, a comprehensive analysis is available that focuses on specific aspects like zip codes, neighborhoods, and homes within certain school districts in Celina. This granular data dives deeper into market trends, allowing for a precise understanding of local dynamics. Additionally, historical data plays a critical role in crafting informed strategies, providing the context needed to make confident decisions that align with your goals.
Unlock Exceptional Service!
Assistance with all your real estate needs in the Dallas-Fort Worth area is just a click or call away. Reach out at 214-940-8149 or connect through the links below.
Meet Your Trusted Realtor and Mortgage Expert in Celina, Texas!
Greetings! I’m Oleg Sedletsky, and I’m excited to introduce myself as your go-to full-time licensed Texas REALTOR® and Mortgage Loan Originator.
I proudly represent JPAR® – Real Estate Brokerage as a REALTOR® and Utopia Mortgage LLC as a Mortgage Loan Originator! My designations and certifications reflect my dedication to helping you achieve your real estate goals in CELINA, TX and other locations in the vibrant Dallas-Fort Worth area!
Whether you’re a homebuyer or a home seller, the information on this page highlights just a fraction of what’s important to know about the Celina, TX real estate market. Data like this is key to understanding trends, making informed decisions, and achieving your real estate goals.
The good news? I can provide much more. When you choose me as your real estate agent, you’ll gain access to detailed neighborhood analyses, historical trends, and everything you need to make confident decisions. Whether you’re buying your dream home or securing the best deal on a sale, I’ll guide you every step of the way with peace of mind.
I’d love to be your trusted advisor in this exciting journey. With a commitment to ongoing professional development, I’m always improving to serve you better. Plus, I’m fluent in English, Ukrainian, and Russian and ready to help whenever you’re ready.
If you’re looking for a dedicated, experienced professional, contact me today!
It’s All About You and Your Real Estate Goals!
My mission is to serve you! With my knowledge and expertise, I’m here to help you achieve all your real estate goals!
I’m passionate about helping homebuyers and home-sellers navigate the exciting real estate landscape in Celina, Texas! Whether you’re searching for your dream home, exploring land options, or looking for commercial properties, my Real Estate Services have you covered.
Contact me today for all your real estate needs in Celina, Texas! Call/text 214-940-8149
A Comprehensive Analysis of Single-Family Residential Housing Market in Celina, TX: 2010 to Present
Discover the trends, stats, and insights shaping Celina’s real estate market year by year!
2010-2020
Celina, TX Real Estate Market Report 2010: Analysis and Trends
Celina, TX Real Estate Market Report 2011: Analysis and Trends
Celina, TX Real Estate Market Report 2012: Analysis and Trends
Celina, TX Real Estate Market Report 2013: Analysis and Trends
Celina, TX Real Estate Market Report 2014: Analysis and Trends
Celina, TX Real Estate Market Report 2015: Analysis and Trends
Celina, TX Real Estate Market Report 2016: Analysis and Trends
Celina, TX Real Estate Market Report 2017: Analysis and Trends
Celina, TX Real Estate Market Report 2018: Analysis and Trends
Celina, TX Real Estate Market Report 2019: Analysis and Trends
Celina, TX Real Estate Market Report 2020: Analysis and Trends
This market analysis is intended solely for educational purposes. This market analysis is based on data sourced from NTREIS, Inc. This analysis is exclusively focused on single-family homes and does not account for other property types. The total number of real estate transactions within the specified period and location may vary. Data accuracy cannot be guaranteed due to potential input errors made by NTREIS users. This market analysis does not account for all new construction home sales. If you need detailed information about recorded property sales or other public records, please contact the appropriate city or county office.

Celina, TX Real Estate: A Comprehensive Analysis of the 2016 Single-Family Residential Housing Market
The Celina, Texas real estate market in 2016 demonstrated steady growth, with notable increases in total sales volume and average sales price. Favorable economic conditions, including lower mortgage rates and energy costs, further encouraged robust buyer activity. This analysis explores the year’s major trends, offering in-depth insights into property prices, key features, and market dynamics.
Key Takeaways and Trends from the 2016 Real Estate Market in Celina, TX
Pricing Range
Property prices ranged from $69,494 to $2,142,600, highlighting a diverse market with options for both first-time buyers and luxury seekers.
Market Efficiency
The average Days on Market decreased slightly to 58 days, reflecting strong demand and quicker transaction cycles compared to previous years.
Unique Outliers
The most expensive property sold, priced at $2,142,600, stood out for its expansive size and luxurious features, influencing the perception of high-end market offerings.
Mortgage Rate Impact
With mortgage rates averaging 3.79%, a lower figure than prior years, buyers found financing more accessible, which likely contributed to higher home sales and market activity.
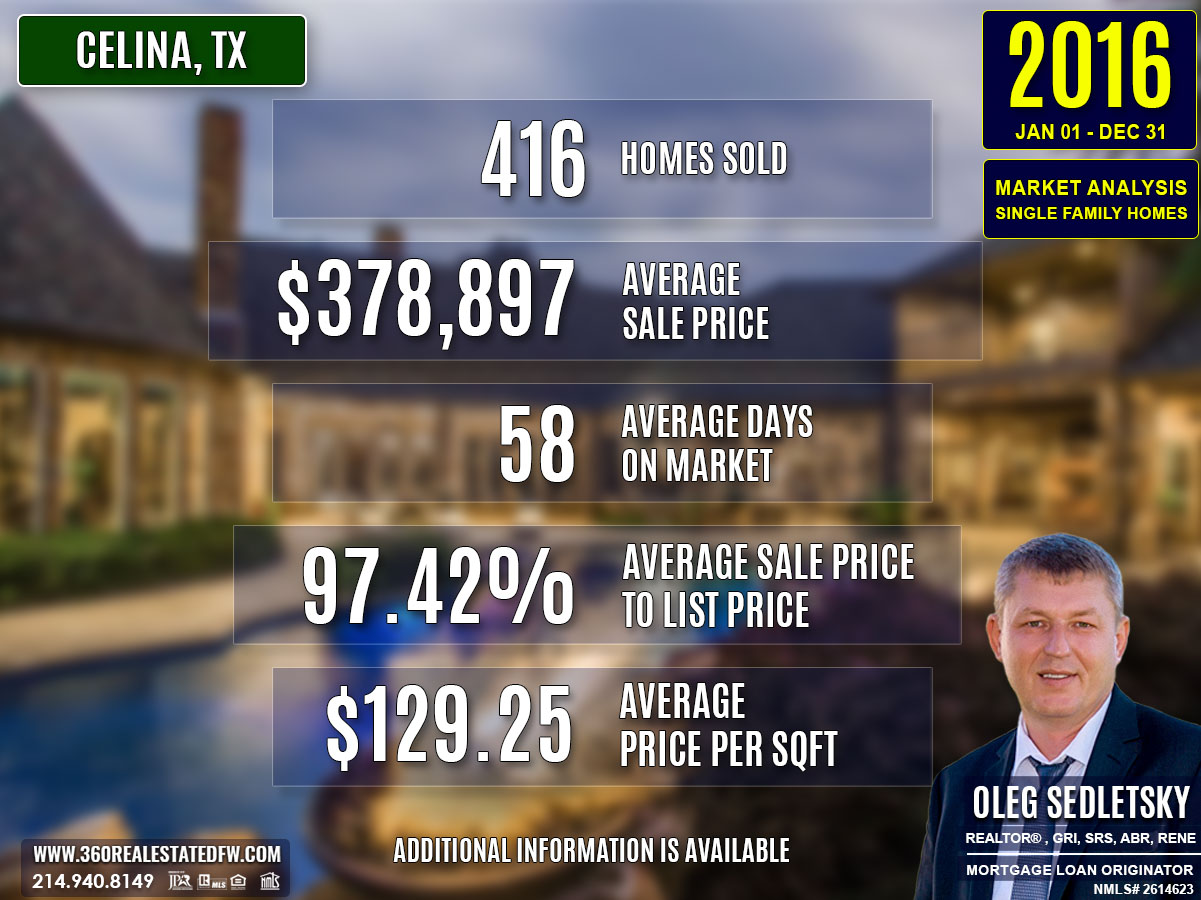
Total Homes Closed
A total of 416 homes were sold in 2016, marking a significant increase from the prior year.
- 221 were new construction homes, reflecting the robust demand for contemporary designs.
- Additionally, 39 homes sold featured pools, indicating sustained interest in recreational amenities.
Property Pricing Insights
- Minimum Price: $69,494
- Maximum Price: $2,142,600
- Average Price: $378,897
- Median Price: $356,236
The property prices showed healthy growth, driven by a mix of affordable and high-end transactions.
Property Size and Features
Bedrooms: Average of 4 bedrooms per home.
Bathrooms: Average of 3 (including full and half baths).
Square Footage:
- Minimum: 960 sq. ft.
- Maximum: 9,057 sq. ft.
- Average: 2,906 sq. ft.
Lot Size:
- Maximum: 20.188 acres.
- Average: 0.771 acres.
These metrics highlight the variety of property sizes available to meet diverse buyer needs.
Market Dynamics
- Days on Market (DOM): Average of 58 days, showing relatively quick sales turnover.
- ClsPr/LstPr Ratio: Average of 97.42% indicates sellers were able to close near asking prices.
- ClsPr/OLP Ratio: Average of 96.56% reflects consistent buyer interest and realistic initial pricing strategies.
- Average Price per Square Foot (Pr$/SqFt): $129.25, marking an increase in property value compared to prior years.
The market dynamics convey a competitive environment, with homes selling faster and closer to their asking prices.
Insights into the Most Expensive Celina, TX Property Sold in 2016
The most expensive property sold in 2016 was an opulent custom home featuring a suite of luxury amenities. This property set a benchmark for high-end real estate in Celina.
- Price: $2,142,600
- Beds: 5
- Baths: 6 (4 full, 2 half)
- Square Footage: 9,057 sq. ft.
- Price per Square Foot: $236.57
- Lot Size: 3.010 acres
- Days on Market (DOM): 4
- ClsPr/LstPr Ratio: 99.66%
- ClsPr/OLP Ratio: 99.66%
- Year Built: 2007
The property captivated buyers with its resort-style backyard, featuring a pool, spa, and waterfall, alongside separate guest quarters ideal for multi-generational living. Its swift sale in just four days highlighted the strong demand for distinctive luxury homes. The sale of this luxurious home reaffirmed the growing strength of the high-end market in Celina, TX. It drew attention to the region’s capacity to cater to affluent buyers while inspiring competitive pricing across similar properties. This addition to the market dynamics has likely encouraged sellers to invest in upscale renovations to attract interest and higher valuations.
Economic context
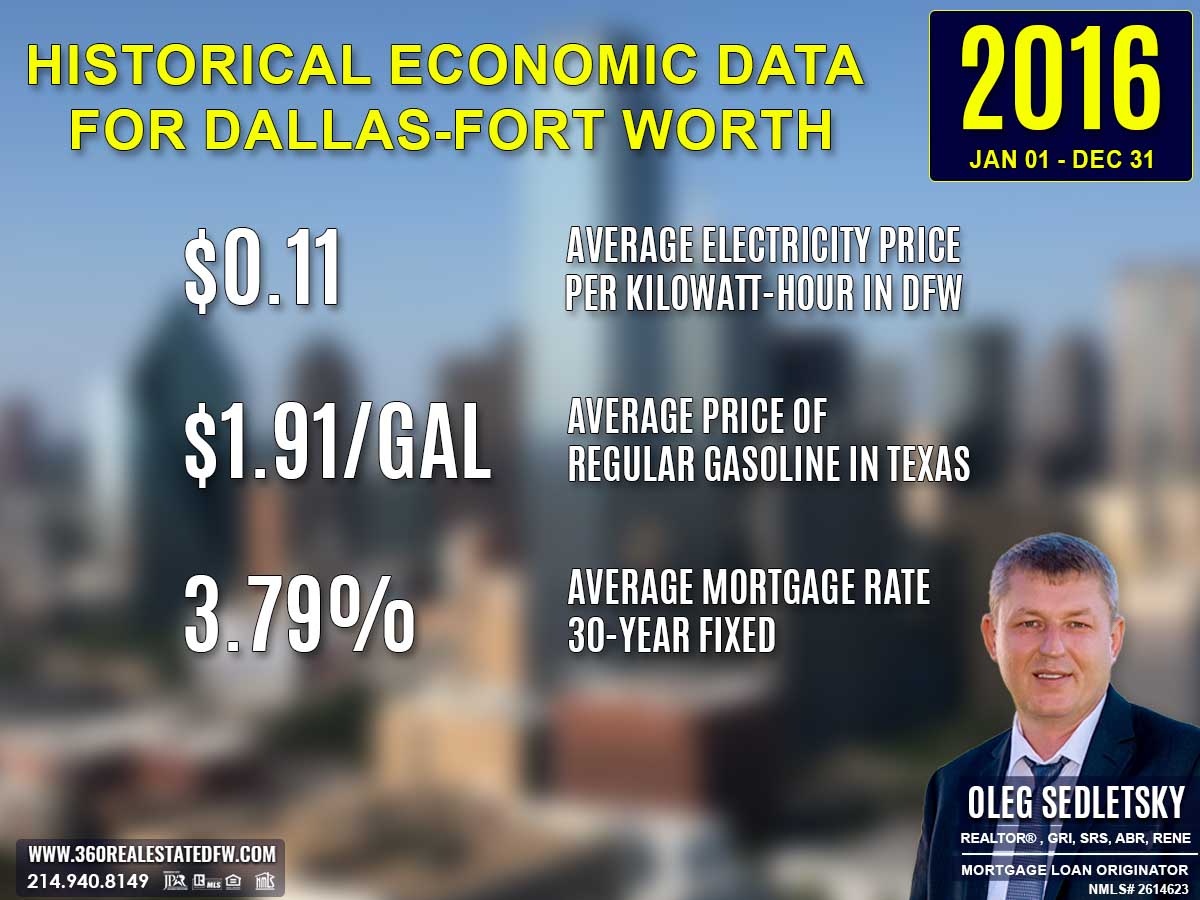
Average Electricity Costs in Dallas-Fort Worth in 2016
Electricity prices continued to decrease, settling at $0.11 per kilowatt-hour in 2016, down from $0.12 in 2015. This steady decline further incentivized interest in larger homes, which naturally consume more power. The trend also nudged developers to prioritize energy efficiency in new housing projects.
Average Price for Regular Gasoline in Texas in 2016
Gas prices dropped further to $1.91 per gallon in 2016, down from $2.17 in 2015. This decline reduced commuter expenses, inspiring homebuyers to explore housing options further from city centers. Properties in areas with good road infrastructure likely became more desirable, as homebuyers factored in affordable fuel costs.
Average 30-Year Fixed Mortgage Rate in 2016
Mortgage rates fell slightly again, settling at 3.79% in 2016, compared to 3.99% the prior year. This favorable environment for financing encouraged many homebuyers to jump into the market. Getting pre-approved with a local mortgage loan originator ensured buyers could seize opportunities quickly and position themselves in a competitive market.
Curious about today’s mortgage rates and the home you can comfortably afford?
Submit a no-obligation mortgage application today and get pre-approved to determine your budget and take the first step toward homeownership with confidence.
Overview of Differences Between the 2016 and 2015 Real Estate Markets in Celina, Texas
Total Homes Sold
2016: 416
2015: 363
A 14.6% increase in total homes sold demonstrates stronger market activity and higher buyer demand in 2016.
Average Sales Price
2016: $378,897
2015: $316,532
The average sales price rose by nearly 20%, reflecting heightened competition and an upward trend in property values.
Average Days on Market (DOM)
2016: 58 days
2015: 54 days
A slight increase in DOM suggests a marginally slower pace, although the market remained fundamentally strong and efficient.
Average Price Per Square Foot
2016: $129.25
2015: $113.22
A 14% rise in price per square foot highlights higher valuation per property, possibly due to demand for premium features and newer construction homes.
Number of Homes with Pools
2016: 39
2015: 34
The number of homes with pools increased, showcasing greater availability of upscale or leisure-focused features.
Number of New Construction Homes
2016: 221
2015: 161
A 37.3% increase in new construction homes indicates an expanded inventory of modern homes catering to buyer preferences for contemporary designs and energy efficiency.
Most Expensive Property Sold
2016: $2,142,600 (9,057 sqft, $236.57/sqft, DOM 4)
2015: $1,500,000 (10,465 sqft, $143.33/sqft, DOM 425)
The highest-priced property in 2016 saw a significant leap in price and price per square foot, reflecting the market’s ability to command higher premiums for luxury estates. However, its much shorter DOM compared to 2015 suggests a stronger demand for high-end properties.
Summary of Real Estate Market Analysis for Celina, TX in 2016
The 2016 real estate market in Celina, Texas demonstrated remarkable activity and growth. The surge in total homes sold, coupled with favorable economic conditions like lower mortgage rates and declining energy costs, created a competitive and attractive environment for both buyers and sellers. With an increased availability of new construction homes and highly desirable listings, the year highlighted the market’s adaptability to diverse buyer preferences and seller ambitions.
Homebuyers and First-Time Homebuyers Perspective
For homebuyers, especially first-time buyers, 2016 was rich with opportunities. Lower mortgage rates of 3.79% made homeownership more attainable, while the wide range of pricing options—from entry-level to luxury properties—catered to varied budgets.
Securing mortgage pre-approval was crucial in such a fast-moving market, giving buyers an edge by increasing their credibility and streamlining the buying process.
The increase in new construction homes further provided modern, move-in-ready housing options, appealing particularly to those looking for contemporary amenities and energy-efficient designs. Buyers needed to act swiftly, as homes spent an average of just 58 days on the market, reflecting a fast-paced and competitive buying process.
Home-Sellers Perspective
For home-sellers, 2016 was a favorable year, with an average close price to listing price ratio of 97.42%, reflecting strong buyer demand. The increase in average property values and price per square foot bolstered selling confidence, while well-maintained and updated homes sold quickly in the competitive market. The growing popularity of new construction did, however, create added pressure for older properties to match aesthetic and functional standards. Sellers benefited greatly from collaborating with realtors, who provided important marketing strategies, crafted effective listing presentations, and advised on competitive pricing.
Final Thoughts
The 2016 real estate market in Celina, TX showcased a balance of opportunities and challenges for both buyers and sellers. Lower mortgage rates and robust activity in new construction encouraged market growth, while the fast pace of transactions emphasized the need for informed decision-making and timely actions. This year reinforced the importance of preparation, strategy, and adaptability in achieving success in the real estate market.
Why Historical Statistical Data Matters in the Celina, Texas Real Estate Market
Did you know that Appraisers and Realtors rely on historical statistical data to determine a property’s current value?
The information presented above is just a small glimpse into the wealth of essential data available to help both homebuyers and sellers set realistic expectations and gain an initial understanding of the real estate market in Celina, Texas. Real estate transactions are intricate, and what you see here is merely a sample of the many factors at play in each deal in this city.
Beyond these insights, a comprehensive analysis is available that focuses on specific aspects like zip codes, neighborhoods, and homes within certain school districts in Celina. This granular data dives deeper into market trends, allowing for a precise understanding of local dynamics. Additionally, historical data plays a critical role in crafting informed strategies, providing the context needed to make confident decisions that align with your goals.
Unlock Exceptional Service!
Assistance with all your real estate needs in the Dallas-Fort Worth area is just a click or call away. Reach out at 214-940-8149 or connect through the links below.
Meet Your Trusted Realtor and Mortgage Expert in Celina, Texas!
Greetings! I’m Oleg Sedletsky, and I’m excited to introduce myself as your go-to full-time licensed Texas REALTOR® and Mortgage Loan Originator.
I proudly represent JPAR® – Real Estate Brokerage as a REALTOR® and Utopia Mortgage LLC as a Mortgage Loan Originator! My designations and certifications reflect my dedication to helping you achieve your real estate goals in CELINA, TX and other locations in the vibrant Dallas-Fort Worth area!
Whether you’re a homebuyer or a home seller, the information on this page highlights just a fraction of what’s important to know about the Celina, TX real estate market. Data like this is key to understanding trends, making informed decisions, and achieving your real estate goals.
The good news? I can provide much more. When you choose me as your real estate agent, you’ll gain access to detailed neighborhood analyses, historical trends, and everything you need to make confident decisions. Whether you’re buying your dream home or securing the best deal on a sale, I’ll guide you every step of the way with peace of mind.
I’d love to be your trusted advisor in this exciting journey. With a commitment to ongoing professional development, I’m always improving to serve you better. Plus, I’m fluent in English, Ukrainian, and Russian and ready to help whenever you’re ready.
If you’re looking for a dedicated, experienced professional, contact me today!
It’s All About You and Your Real Estate Goals!
My mission is to serve you! With my knowledge and expertise, I’m here to help you achieve all your real estate goals!
I’m passionate about helping homebuyers and home-sellers navigate the exciting real estate landscape in Celina, Texas! Whether you’re searching for your dream home, exploring land options, or looking for commercial properties, my Real Estate Services have you covered.
Contact me today for all your real estate needs in Celina, Texas! Call/text 214-940-8149
A Comprehensive Analysis of Single-Family Residential Housing Market in Celina, TX: 2010 to Present
Discover the trends, stats, and insights shaping Celina’s real estate market year by year!
2010-2020
Celina, TX Real Estate Market Report 2010: Analysis and Trends
Celina, TX Real Estate Market Report 2011: Analysis and Trends
Celina, TX Real Estate Market Report 2012: Analysis and Trends
Celina, TX Real Estate Market Report 2013: Analysis and Trends
Celina, TX Real Estate Market Report 2014: Analysis and Trends
Celina, TX Real Estate Market Report 2015: Analysis and Trends
Celina, TX Real Estate Market Report 2016: Analysis and Trends
Celina, TX Real Estate Market Report 2017: Analysis and Trends
Celina, TX Real Estate Market Report 2018: Analysis and Trends
Celina, TX Real Estate Market Report 2019: Analysis and Trends
Celina, TX Real Estate Market Report 2020: Analysis and Trends
This market analysis is intended solely for educational purposes. This market analysis is based on data sourced from NTREIS, Inc. This analysis is exclusively focused on single-family homes and does not account for other property types. The total number of real estate transactions within the specified period and location may vary. Data accuracy cannot be guaranteed due to potential input errors made by NTREIS users. This market analysis does not account for all new construction home sales. If you need detailed information about recorded property sales or other public records, please contact the appropriate city or county office.

Celina, TX Real Estate: A Comprehensive Analysis of the 2015 Single-Family Residential Housing Market
The 2015 real estate market in Celina, Texas showed strong growth and remarkable activity compared to prior years. With 363 closed transactions, higher inventories of new constructions, and significant interest in upscale properties, the market displayed a dynamic mix of affordability and luxury. This analysis dives into the key metrics, trends, and unique factors that shaped the year’s housing market.
Key Takeaways and Trends from the 2015 Real Estate Market in Celina, TX
1. Pricing Range
The market witnessed pricing ranging from $45,000 to $1,500,000, offering opportunities for buyers with varying budgets. The average sales price suggests a slight consolidation compared to 2014, balancing affordability with premium options.
2. Market Efficiency
Homes stayed on the market for an average of 54 days, down from 64 in 2014, reflecting increased efficiency and strong demand. Sellers frequently secured competitive offers with a ClsPr/LstPr ratio of 97.21%.
3. Unique Outliers
The most expensive property sold was a $1,500,000 estate offering unmatched luxury features, setting a new high for the area. Such high-end transactions underscore the market’s growing appeal to affluent buyers.
4. Mortgage Rates Impact
Mortgage rates averaged 3.99%, a noticeable dip from 4.31% in 2014. This decrease likely spurred greater buyer activity and contributed to higher transaction volumes across multiple price points.
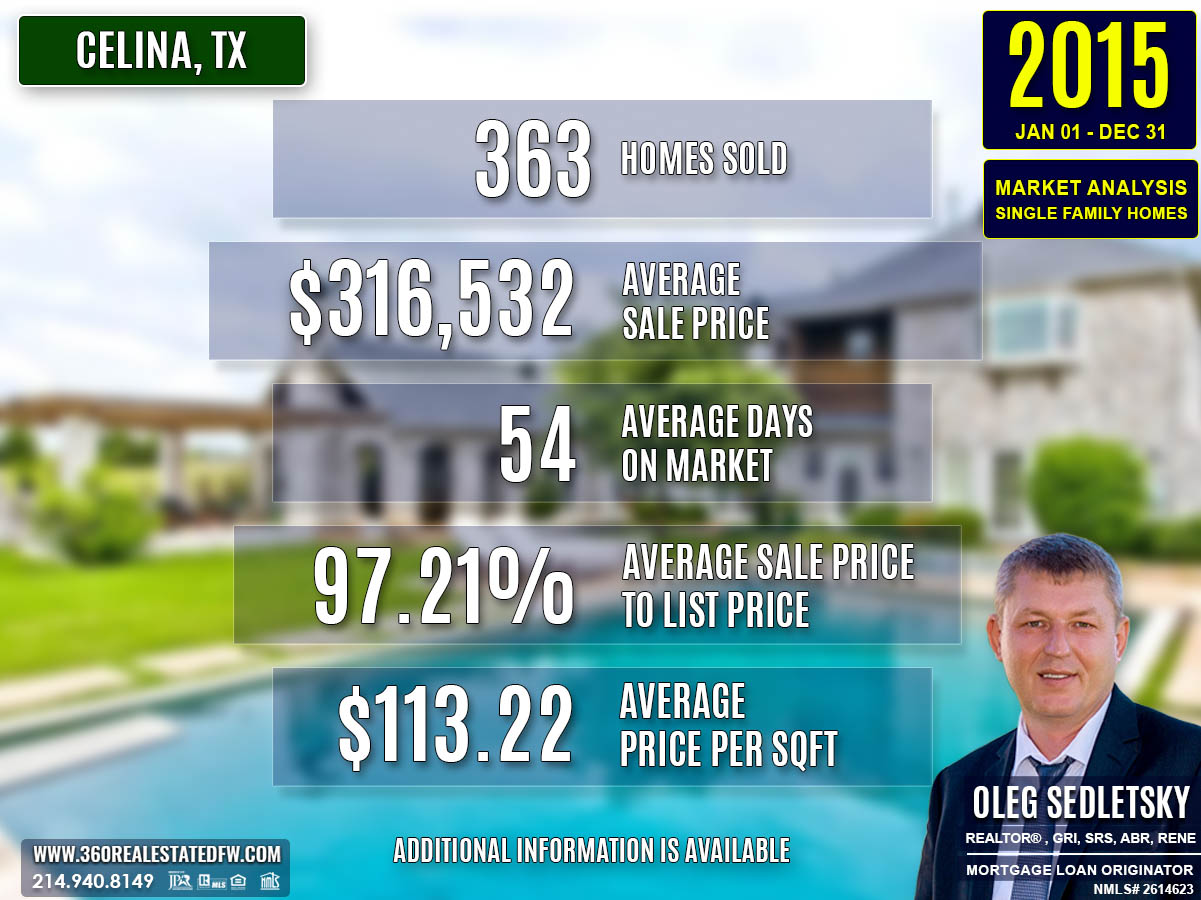
Total Homes Closed
A total of 363 homes were sold in Celina, TX in 2015, marking a significant increase compared to prior years.
- New Construction Homes: 161, indicating a surge in new construction activity and modern housing preferences.
- Homes with Pools: 34, reflecting consistent demand for properties with premium amenities.
Property Pricing Insights
- Minimum Price: $45,000, ideal for budget-conscious buyers.
- Maximum Price: $1,500,000, representing the high end of the market.
- Average Price: $316,532, with continuing appreciation in home values.
- Median Price: $286,500, highlighting a strong mid-market segment.
Property Size and Features
- Bedrooms: Average of 4, suitable for families.
- Bathrooms: Average of 3, ensuring comfort and convenience.
- Square Footage: Average of 2,745 sq. ft., reflecting spacious home designs.
- Lot Size: Ranged up to 27.7 acres, catering to diverse buyer preferences, from compact lots to expansive estates.
Market Dynamics
- Average Days on Market (DOM): Averaging 54 days, showcasing increased market efficiency.
- Average Close Price to Listing Price Ratio (ClsPr/LstPr): 97.21%, indicating sellers were achieving near-asking prices.
- Average Close Price to Original Listing Price Ratio (ClsPr/OLP): 96.17%, reflecting balanced pricing strategies.
- Average Price per Square Foot (Pr$/SqFt): $113.22, a notable increase from prior years.
Insights into the Most Expensive Celina, TX Property Sold in 2015
The most expensive property in 2015 was a custom estate home sold for $1,500,000. This unique property offered extensive luxury features and high-end amenities, setting new benchmarks for the premium housing market in Celina.
Property Highlights:
- Price: $1,500,000
- Beds/Baths: 6 bedrooms, 6 baths (5 full, 1 half)
- Square Footage: 10,465 sq. ft.
- Price per Square Foot: $143.33
- Lot Size: 2.103 acres
- Days on Market (DOM): 425 days
- ClsPr/LstPr Ratio: 93.03%
- ClsPr/OLP Ratio: 83.33%
- Year Built: 2007
This property stood out with features like an indoor basketball court, gym, media room, wine grotto, and a 90,000-gallon pool with nine waterfalls and a lazy river. Although this property took longer to sell at 425 DOM, it drew attention to Celina’s high-end market, highlighting the area’s potential as a luxury home destination. Its lower ClsPr/LstPr ratio underscored the challenges of pricing unique estates but also set a standard for luxury offerings in the city.
Economic context

Average Electricity Costs in Dallas-Fort Worth in 2015
Electricity prices dipped to $0.12 per kilowatt-hour in 2015, down from $0.13 in 2014. This small decrease likely provided a bit of financial breathing room to households, which could have been channeled into homeownership costs. Prospective homebuyers looking for energy-friendly homes continued to dominate market trends.
Average Price for Regular Gasoline in Texas in 2015
Gas prices fell significantly to $2.17 per gallon in 2015, down from $3.15 in 2014. Plummeting fuel costs were a game-changer for homebuyers considering longer commutes. Lower transportation expenses made suburban and rural areas increasingly attractive, potentially driving demand for properties in these regions.
Average 30-Year Fixed Mortgage Rate in 2015
Mortgage rates declined slightly to 3.99% in 2015, down from 4.31% in 2014. homebuyers took advantage of this drop to enter the housing market or refinance existing loans for more affordable terms. Partnering with a local mortgage loan originator to secure pre-approval was crucial for those navigating the competitive environment fueled by lower rates.
Curious about today’s mortgage rates and the home you can comfortably afford?
Submit a no-obligation mortgage application today and get pre-approved to determine your budget and take the first step toward homeownership with confidence.
Overview of Differences Between the 2015 and 2014 Real Estate Markets in Celina, Texas
Total Homes Sold
2014: 271 homes closed.
2015: 363 homes closed.
The market saw a 34% increase in sales activity, indicating stronger buyer demand and a more active real estate market in 2015.
Average Sales Price
2014: $318,900.
2015: $316,532.
A slight decrease in the average price suggests stable yet competitive pricing, with broader participation in mid-tier transactions driving the average down marginally.
Average Days on Market (DOM)
2014: 64 days.
2015: 54 days.
Properties in 2015 sold 15% faster, showing improved market efficiency and heightened buyer urgency.
Average Close Price to Listing Price (ClsPr/LstPr) Ratio
2014: 97.04%.
2015: 97.21%.
Sellers in 2015 achieved slightly better results relative to listing prices, reflecting strong buyer confidence and competitive market conditions.
Average Price per Square Foot (Pr$/SqFt)
2014: $102.75.
2015: $113.22.
A 10% increase in price per square foot highlights growing property value and demand for existing and new construction homes.
New Construction Homes
2014: 78 homes sold.
2015: 161 homes sold.
The more than twofold increase in new construction sales shows a significant investment in modern builds and buyer preference for updated amenities.
Homes with Pools
2014: 43 homes sold.
2015: 34 homes sold.
A slight decline in sales of pool homes may indicate shifting buyer priorities or limited inventory of such properties.
Most Expensive Property Sold
2014: $1,450,000, 7,564 sq. ft., $191.70/sq. ft., sold in 81 days.
2015: $1,500,000, 10,465 sq. ft., $143.33/sq. ft., sold in 425 days.
Both years showcased standout luxury properties, but the 2015 property, despite being larger, fetched a lower price per square foot and spent significantly longer on the market.
Economic Factors
Mortgage Rates: 2014 saw an average rate of 4.31%, while 2015 experienced a drop to 3.99%.
Gas Prices: $3.15 per gallon (2014) vs $2.17 per gallon (2015).
Lower mortgage and gas prices likely boosted market activity by increasing affordability and disposable income for buyers.
Market Dynamics
2014 trends reflected steady activity, with a slightly longer DOM and fewer new builds.
2015 saw increased momentum, faster transactions, and a shift toward new construction as a dominant supply.
The market’s progression underscored growing buyer confidence, favorable economic conditions, and higher demand for modern, customizable homes.
Summary of Real Estate Market Analysis for Celina, TX in 2015
The 2015 real estate market in Celina, TX showcased notable growth and dynamism, driven by higher home sales, strong price appreciation, and faster market activity. With a total of 363 homes sold and a thriving new construction sector, the market proved to be favorable for both buyers and sellers.
Homebuyers and First-Time Homebuyers Perspective
For homebuyers, particularly those entering the market for the first time, 2015 offered a range of opportunities due to lower mortgage rates averaging 3.99%. These favorable rates enhanced affordability, allowing buyers to secure higher-value homes while maintaining manageable budgets. The growing inventory of new construction and luxurious properties, including homes with pools, provided ample choices for diverse needs. However, navigating the fast-paced market required informed decision-making. Buyers who partnered with experienced realtors gained an edge by receiving expert advice, accessing strategic opportunities, and ensuring a smooth home-buying process.
Home-Sellers Perspective
Home-sellers found themselves in a competitive and advantageous market, with homes selling faster and achieving closer-to-asking prices. The average DOM dropped to 54 days, reflecting the strength of buyer activity. Sellers who leveraged the expertise of realtors benefited significantly from effective marketing strategies, accurate pricing, and insights that maximized their returns. The presence of high-value properties, like the $1.5M custom estate, set new benchmarks, further boosting the market’s appeal. Realtor guidance played a pivotal role in navigating the complexities of selling, ensuring smooth transactions and successful outcomes.
Final Thoughts
The 2015 Celina, Texas real estate market highlighted the importance of preparation, knowledge, and professional expertise. Buyers and sellers who remained well-informed and partnered with experienced realtors gained a significant advantage in this competitive landscape. Mortgage rates, property diversity, and market activity all underscored the necessity of timely decisions and strategic actions. Whether buying or selling, access to expert guidance was invaluable in achieving success. The year reinforced that a combination of market savvy, preparation, and collaboration with trusted professionals can ensure positive results for all participants in real estate transactions.
Why Historical Statistical Data Matters in the Celina, Texas Real Estate Market
Did you know that Appraisers and Realtors rely on historical statistical data to determine a property’s current value?
The information presented above is just a small glimpse into the wealth of essential data available to help both homebuyers and sellers set realistic expectations and gain an initial understanding of the real estate market in Celina, Texas. Real estate transactions are intricate, and what you see here is merely a sample of the many factors at play in each deal in this city.
Beyond these insights, a comprehensive analysis is available that focuses on specific aspects like zip codes, neighborhoods, and homes within certain school districts in Celina. This granular data dives deeper into market trends, allowing for a precise understanding of local dynamics. Additionally, historical data plays a critical role in crafting informed strategies, providing the context needed to make confident decisions that align with your goals.
Unlock Exceptional Service!
Assistance with all your real estate needs in the Dallas-Fort Worth area is just a click or call away. Reach out at 214-940-8149 or connect through the links below.
Meet Your Trusted Realtor and Mortgage Expert in Celina, Texas!
Greetings! I’m Oleg Sedletsky, and I’m excited to introduce myself as your go-to full-time licensed Texas REALTOR® and Mortgage Loan Originator.
I proudly represent JPAR® – Real Estate Brokerage as a REALTOR® and Utopia Mortgage LLC as a Mortgage Loan Originator! My designations and certifications reflect my dedication to helping you achieve your real estate goals in CELINA, TX and other locations in the vibrant Dallas-Fort Worth area!
Whether you’re a homebuyer or a home seller, the information on this page highlights just a fraction of what’s important to know about the Celina, TX real estate market. Data like this is key to understanding trends, making informed decisions, and achieving your real estate goals.
The good news? I can provide much more. When you choose me as your real estate agent, you’ll gain access to detailed neighborhood analyses, historical trends, and everything you need to make confident decisions. Whether you’re buying your dream home or securing the best deal on a sale, I’ll guide you every step of the way with peace of mind.
I’d love to be your trusted advisor in this exciting journey. With a commitment to ongoing professional development, I’m always improving to serve you better. Plus, I’m fluent in English, Ukrainian, and Russian and ready to help whenever you’re ready.
If you’re looking for a dedicated, experienced professional, contact me today!
It’s All About You and Your Real Estate Goals!
My mission is to serve you! With my knowledge and expertise, I’m here to help you achieve all your real estate goals!
I’m passionate about helping homebuyers and home-sellers navigate the exciting real estate landscape in Celina, Texas! Whether you’re searching for your dream home, exploring land options, or looking for commercial properties, my Real Estate Services have you covered.
Contact me today for all your real estate needs in Celina, Texas! Call/text 214-940-8149
A Comprehensive Analysis of Single-Family Residential Housing Market in Celina, TX: 2010 to Present
Discover the trends, stats, and insights shaping Celina’s real estate market year by year!
2010-2020
Celina, TX Real Estate Market Report 2010: Analysis and Trends
Celina, TX Real Estate Market Report 2011: Analysis and Trends
Celina, TX Real Estate Market Report 2012: Analysis and Trends
Celina, TX Real Estate Market Report 2013: Analysis and Trends
Celina, TX Real Estate Market Report 2014: Analysis and Trends
Celina, TX Real Estate Market Report 2015: Analysis and Trends
Celina, TX Real Estate Market Report 2016: Analysis and Trends
Celina, TX Real Estate Market Report 2017: Analysis and Trends
Celina, TX Real Estate Market Report 2018: Analysis and Trends
Celina, TX Real Estate Market Report 2019: Analysis and Trends
Celina, TX Real Estate Market Report 2020: Analysis and Trends
This market analysis is intended solely for educational purposes. This market analysis is based on data sourced from NTREIS, Inc. This analysis is exclusively focused on single-family homes and does not account for other property types. The total number of real estate transactions within the specified period and location may vary. Data accuracy cannot be guaranteed due to potential input errors made by NTREIS users. This market analysis does not account for all new construction home sales. If you need detailed information about recorded property sales or other public records, please contact the appropriate city or county office.

Celina, TX Real Estate: A Comprehensive Analysis of the 2014 Single-Family Residential Housing Market
The Celina, Texas real estate market in 2014 experienced notable growth and diversification. With higher sales volume, increased property values, and improved market efficiency, this year marked a robust period for both homebuyers and home sellers. This analysis explores the year’s major trends, offering in-depth insights into property prices, features, and market dynamics.
Key Takeaways and Trends from the 2014 Real Estate Market in Celina, TX
Pricing Range
The year saw an increased average sales price and a higher price per square foot, reflecting a clear appreciation in property values. HomeBuyers were willing to invest more for quality homes that met their needs.
Market Efficiency
A reduction in average days on market, alongside an improved close price to listing price ratio, signaled stronger demand and heightened buyer competition.
Unique Outliers
The year’s most expensive property, priced at $1,450,000, represented a luxurious offering distinct in its design and features. Such high-end properties carved a niche in the market.
Mortgage Rates Impact
The slight increase in average mortgage rates to 4.31% may have influenced affordability, particularly for first-time buyers. However, overall sales growth suggests the impact was moderate.
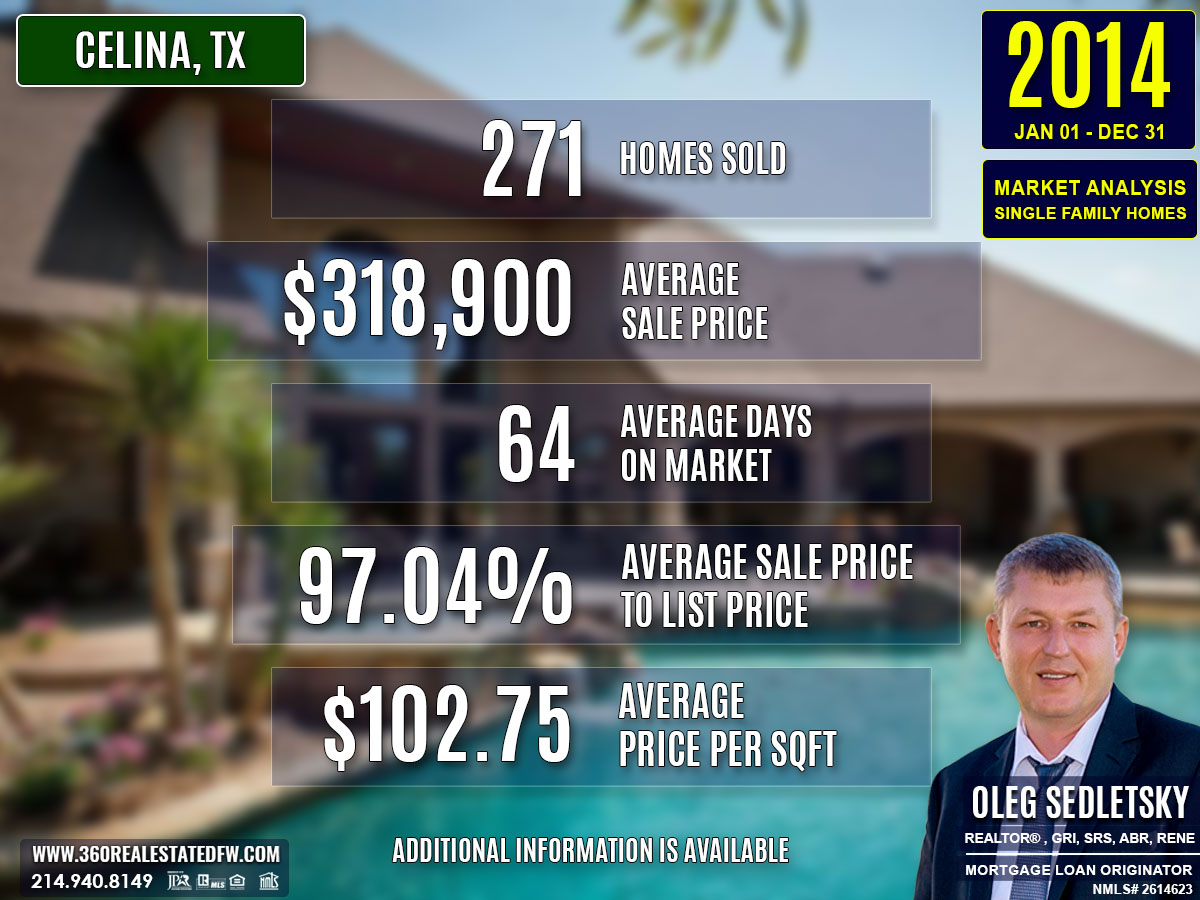
Total Homes Closed
A total of 271 residential single-family homes were sold, marking a significant increase from previous years.
- New Construction Homes accounted for 78 of these, reflecting developer confidence and strong buyer demand for modern homes.
- Homes with Pools reached a notable 43, suggesting heightened interest in luxury amenities.
Property Pricing Insights
- Minimum Price: $47,000
- Maximum Price: $1,450,000
- Average Price: $318,900
- Median Price: $292,000
These figures reveal broad pricing diversity, accommodating a wide range of buyer budgets.
Property Size and Features
- Average Bedrooms: 4
- Average Bathrooms: 3 (including 1 half bath per property on average)
- Average Square Footage: 2,990 sq.ft.
- Average Lot Size: 1.55 acres
The market offered generously sized homes, ideal for families and buyers seeking extra space.
Market Dynamics
- Average Days on Market (DOM): 64, a decrease from past years, highlighting faster sales.
- Average Close Price to Listing Price Ratio (ClsPr/LstPr): 97.04%, an improvement in pricing alignment.
- Average Close Price to Original Listing Price Ratio (ClsPr/OLP): 96.11%, indicative of realistic seller expectations.
- Average Price Per Square Foot (Pr$/SqFt): $102.75, reflecting increased buyer willingness to pay for quality homes.
Insights into the Most Expensive Celina, TX Property Sold in 2014
The most expensive home sold in 2014 was a lavish custom estate ideal for high-end buyers. Key metrics include:
- Price: $1,450,000
- Bedrooms: 6
- Bathrooms: 6 (5 full, 1 half)
- Square Footage: 7,564 sq.ft.
- Lot Size: 3.45 acres
- Price Per Square Foot: $191.70
- Close Price to Listing Price Ratio (ClsPr/LstPr): 80.78%
- Close Price to Original Listing Price Ratio (ClsPr/OLP): 80.78%
- Days on Market (DOM): 81
- Year Built: 2003 (remodeled in 2013)
This custom built property, complete with a pool, spa, gazebo, and multi-generational guest house, emphasized the demand for large, feature-rich residences. Its sale helped define the upper end of the market, boosting average property values and solidifying demand at higher pricing tiers.
Economic context

Average Electricity Costs in Dallas-Fort Worth in 2014
Electricity prices rose slightly to $0.13 per kilowatt-hour in 2014, up from $0.12 in 2013. This gradual increase added pressure to household budgets, further emphasizing the demand for energy-efficient properties. Sellers with homes featuring solar panels or updated appliances likely had an edge in the real estate market.
Average Price for Regular Gasoline in Texas in 2014
Gas prices decreased to $3.15 per gallon in 2014, down from $3.32 in 2013. Lower fuel costs may have encouraged homebuyers to look at properties in outer suburban areas, knowing transportation expenses were more manageable. This shift could have spurred demand in regions where homes were larger and more economical than urban alternatives.
Average 30-Year Fixed Mortgage Rate in 2014
Mortgage rates edged up to 4.31% in 2014 from the previous year’s 4.16%. This small increase emphasized the importance of timing in home purchases, as homebuyers aimed to lock in favorable terms before rates rose further. Securing pre-approval with a local mortgage loan originator remained a vital step for buyers to gain financial clarity during the purchasing process.
Curious about today’s mortgage rates and the home you can comfortably afford?
Submit a no-obligation mortgage application today and get pre-approved to determine your budget and take the first step toward homeownership with confidence.
Overview of Differences Between the 2014 and 2013 Real Estate Markets in Celina, Texas
Total Homes Sold
2013: 180 homes sold.
2014: 271 homes sold, an increase of 91 homes, reflecting a 50.5% rise in real estate activity and higher market demand.
Homes with Pools
2013: 19 properties.
2014: 43 properties, showing a substantial rise in demand for premium amenities like pools.
New Construction Homes
2013: 31 properties.
2014: 78 properties, emphasizing a growing interest in modern, newly built homes
Average Sales Price
2013: $238,224.
2014: $318,900, a significant $80,676 increase (33.9%) in average home prices, showcasing an upward trend in property values.
Average Days on Market (DOM)
2013: 65 days.
2014: 64 days, showing a slightly faster market turnaround, indicating continued market efficiency.
Average Close Price to Listing Price Ratio (ClsPr/LstPr)
2013: 96.28%.
2014: 97.04%, an improvement in sellers achieving closer to their listing prices, driven by competitive demand.
Average Price Per Square Foot (Pr$/SqFt)
2013: $89.23.
2014: $102.75, an increase of $13.52 (15.1%), reflecting rising property valuations and buyers willing to pay more per unit of space.
Highest Sale Price
2013: $685,000 for a custom country estate.
2014: $1,450,000 for a luxury home with extensive amenities, illustrating a shift in the market to high-end property transactions.
Economic Conditions
2013: Average 30-year mortgage rate at 4.16%.
2014: Average 30-year mortgage rate edged up to 4.31%, slightly increasing financing costs but not enough to dampen market enthusiasm.
Notable Trends and Market Dynamics:
- The number of homes sold surged by 91 homes in 2014, reflecting a much more dynamic and robust real estate market.
- Upward trends in average sale price and price per square foot point to significant property appreciation between the two years.
- The faster days on market and higher close-to-list price ratios in 2014 indicate strong buyer demand and a competitive market.
- Increased new construction and pool-equipped properties suggest a growing interest in modern and upscale housing options.
- Economic factors like slightly higher mortgage rates did not hinder the market’s growth, showcasing sustained buyer confidence.
Summary of Real Estate Market Analysis for Celina, TX in 2014
The 2014 real estate market in Celina, TX showcased significant growth, marked by rising home values, faster transaction times, and diversified buyer preferences. With 271 homes sold, including a notable number of new construction properties and pool-equipped homes, the market reflected both strong demand and evolving needs. This dynamic year offered opportunities for both buyers and sellers, underscoring the importance of preparation and strategy in navigating the real estate landscape.
Homebuyers and First-Time Homebuyers Perspective
For homebuyers, especially first-time purchasers, 2014 provided a mix of challenges and opportunities. Rising average home prices and increased price-per-square-foot values required buyers to act decisively and budget wisely. First-time homebuyers benefitted from a range of property options while needing to keep a close eye on mortgage rates, which slightly increased to 4.31%. Knowledge of market trends and working with an experienced real estate agent proved essential in securing the right property within the fast-moving market.
Home-Sellers Perspective
Home Sellers in 2014 reaped the rewards of stronger market conditions and heightened demand. Reduced days on market and improved close-to-list price ratios demonstrated the market’s efficiency, allowing sellers to achieve competitive outcomes with shorter timelines. Properties with sought-after features like pools and modern amenities gained significant attention, further validating the importance of strategic pricing and professional marketing support. Sellers who prepared their homes effectively were poised to maximize their returns.
Final Thoughts
The 2014 Celina real estate market was a testament to the value of preparation, informed decision-making, and collaboration with seasoned real estate professionals. Buyers navigated a competitive landscape by leveraging market insights, while sellers thrived under favorable conditions by showcasing their properties effectively. For all participants, the year’s success underscored the importance of staying informed and adaptable in a dynamic market environment.
Why Historical Statistical Data Matters in the Celina, Texas Real Estate Market
Did you know that Appraisers and Realtors rely on historical statistical data to determine a property’s current value?
The information presented above is just a small glimpse into the wealth of essential data available to help both homebuyers and sellers set realistic expectations and gain an initial understanding of the real estate market in Celina, Texas. Real estate transactions are intricate, and what you see here is merely a sample of the many factors at play in each deal in this city.
Beyond these insights, a comprehensive analysis is available that focuses on specific aspects like zip codes, neighborhoods, and homes within certain school districts in Celina. This granular data dives deeper into market trends, allowing for a precise understanding of local dynamics. Additionally, historical data plays a critical role in crafting informed strategies, providing the context needed to make confident decisions that align with your goals.
Unlock Exceptional Service!
Assistance with all your real estate needs in the Dallas-Fort Worth area is just a click or call away. Reach out at 214-940-8149 or connect through the links below.
Meet Your Trusted Realtor and Mortgage Expert in Celina, Texas!
Greetings! I’m Oleg Sedletsky, and I’m excited to introduce myself as your go-to full-time licensed Texas REALTOR® and Mortgage Loan Originator.
I proudly represent JPAR® – Real Estate Brokerage as a REALTOR® and Utopia Mortgage LLC as a Mortgage Loan Originator! My designations and certifications reflect my dedication to helping you achieve your real estate goals in CELINA, TX and other locations in the vibrant Dallas-Fort Worth area!
Whether you’re a homebuyer or a home seller, the information on this page highlights just a fraction of what’s important to know about the Celina, TX real estate market. Data like this is key to understanding trends, making informed decisions, and achieving your real estate goals.
The good news? I can provide much more. When you choose me as your real estate agent, you’ll gain access to detailed neighborhood analyses, historical trends, and everything you need to make confident decisions. Whether you’re buying your dream home or securing the best deal on a sale, I’ll guide you every step of the way with peace of mind.
I’d love to be your trusted advisor in this exciting journey. With a commitment to ongoing professional development, I’m always improving to serve you better. Plus, I’m fluent in English, Ukrainian, and Russian and ready to help whenever you’re ready.
If you’re looking for a dedicated, experienced professional, contact me today!
It’s All About You and Your Real Estate Goals!
My mission is to serve you! With my knowledge and expertise, I’m here to help you achieve all your real estate goals!
I’m passionate about helping homebuyers and home-sellers navigate the exciting real estate landscape in Celina, Texas! Whether you’re searching for your dream home, exploring land options, or looking for commercial properties, my Real Estate Services have you covered.
Contact me today for all your real estate needs in Celina, Texas! Call/text 214-940-8149
A Comprehensive Analysis of Single-Family Residential Housing Market in Celina, TX: 2010 to Present
Discover the trends, stats, and insights shaping Celina’s real estate market year by year!
2010-2020
Celina, TX Real Estate Market Report 2010: Analysis and Trends
Celina, TX Real Estate Market Report 2011: Analysis and Trends
Celina, TX Real Estate Market Report 2012: Analysis and Trends
Celina, TX Real Estate Market Report 2013: Analysis and Trends
Celina, TX Real Estate Market Report 2014: Analysis and Trends
Celina, TX Real Estate Market Report 2015: Analysis and Trends
Celina, TX Real Estate Market Report 2016: Analysis and Trends
Celina, TX Real Estate Market Report 2017: Analysis and Trends
Celina, TX Real Estate Market Report 2018: Analysis and Trends
Celina, TX Real Estate Market Report 2019: Analysis and Trends
Celina, TX Real Estate Market Report 2020: Analysis and Trends
This market analysis is intended solely for educational purposes. This market analysis is based on data sourced from NTREIS, Inc. This analysis is exclusively focused on single-family homes and does not account for other property types. The total number of real estate transactions within the specified period and location may vary. Data accuracy cannot be guaranteed due to potential input errors made by NTREIS users. This market analysis does not account for all new construction home sales. If you need detailed information about recorded property sales or other public records, please contact the appropriate city or county office.

Celina, TX Real Estate: A Comprehensive Analysis of the 2013 Single-Family Residential Housing Market
The 2013 Celina, Texas real estate market showcased steady activity, with 180 homes sold and a notable reduction in average days on market. Buyers and sellers navigated shifting dynamics amidst moderating mortgage rates and increasing property price appreciation. This analysis dives deep into the notable trends, market drivers, and outlier properties that defined the year’s real estate performance.
Key Takeaways and Trends from the 2013 Real Estate Market in Celina, TX
Pricing Range
Property prices in 2013 ranged from $35,000 to $685,000, indicating a robust spread to suit varying buyer preferences. The average price per square foot rose to $89.23, reflecting an appreciated value for residential properties.
Market Efficiency
The average DOM decreased to 65 days from the prior year, showing greater market velocity. The close price to listing price ratio remained strong at 96.28%, aligning with competitive dynamics.
Unique Outliers
The most expensive sale, a custom country estate on 10 acres, stood out for its more modest total price and per-square-foot cost relative to previous luxury homes, which suggests value prioritization in high-acreage properties.
Mortgage Rates Impact
The average 30-year fixed mortgage rate increased to 4.16% from 3.88% in 2012. This hike may have tempered some buyer enthusiasm but still maintained affordability at levels supportive of ongoing market activity.
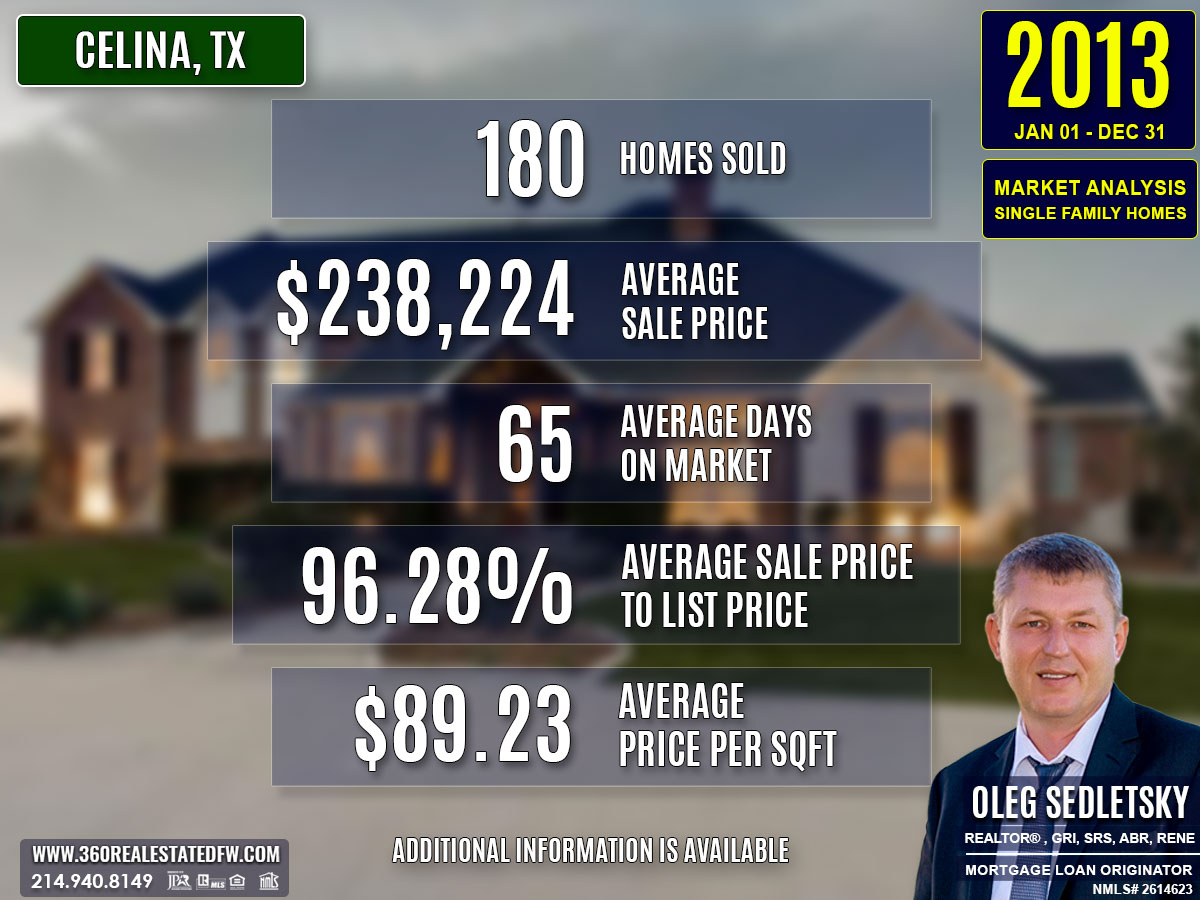
Total Homes Closed
A total of 180 homes closed in 2013, including 31 new construction homes, emphasizing ongoing housing development in the area. Additionally, 19 homes featured pools, reflecting moderate demand for lifestyle-enhancing amenities.
Property Pricing Insights
- Minimum Price: $35,000
- Maximum Price: $685,000
- Average Price: $238,224
- Median Price: $211,698
The pricing spread reveals that while the lower-end market provided cost-efficient options, the high-end spectrum focused on rural luxury estates. The average price fell slightly from 2012 but remained robust overall.
Property Size and Features
- Bedrooms: Homes averaged 4 bedrooms, with 3 as the most common.
- Bathrooms: Most homes included 3 bathrooms, offering ample comfort for families.
- Square Footage: Properties averaged 2,637 square feet, with a median size of 2,519 sq. ft.
- Lot Size: The average lot size of 1.223 acres highlighted the availability of both suburban and rural properties, appealing to diverse buyer needs.
Market Dynamics
- Days on Market (DOM): The average DOM was 65 days, improving significantly compared to previous years, indicating stronger demand and faster sales.
- ClsPr/LstPr Ratio: The close price to listing price ratio averaged 96.28%, reflecting consistent pricing strategies aligning with buyer expectations.
- ClsPr/OLP Ratio: The close price to original listing price ratio nearly matched at 94.59%, suggesting minimal price adjustments were needed to finalize sales.
- Price Per Square Foot: At $89.23, this metric continued its upward trajectory, signaling property appreciation even with slight decreases in transaction totals.
Insights into the Most Expensive Celina, TX Property Sold in 2013
The most notable sale of 2013 was a custom 10-acre country estate featuring high-end outdoor amenities and agricultural capability. The property offered luxury and practicality, appealing to a specific buyer demographic. Below are the key metrics of this property:
- Price: $685,000
- Beds: 3
- Baths: 4 (3 full, 1 half)
- Square Footage: 3,939 sq. ft.
- Price per Square Foot: $173.90
- Lot Size: 10.450 acres
- Days on Market (DOM): 140
- ClsPr/LstPr (Close Price to Listing Price): 95.82%
- ClsPr/OLP (Close Price to Original Listing Price): 93.85%
- Year Built: 1999
This property, with its extensive landscaping, pool, barn, and agricultural exemption, demonstrated the demand for large, rural estates in 2013. Its sale, however, required a longer DOM compared to other properties, reflecting its niche appeal. The sale of this high-value property highlighted the demand for unique rural estates in Celina. While selling at a lower price than 2012’s top-tier home, it showcased buyers prioritizing size and utility over interior luxury. These types of transactions indicate the market’s ability to cater to various buyer needs, contributing to its overall diversity and health.
Economic context

Average Electricity Costs in Dallas-Fort Worth in 2013
Electricity prices increased to $0.12 per kilowatt-hour in 2013, compared to $0.11 in 2012. This slight rise might have led consumers to reassess their energy usage and consider more energy-efficient homes. Real estate agents likely saw growing interest in properties with features like modern insulation or smart energy systems, which could offset rising utility expenses.
Average Price for Regular Gasoline in Texas in 2013
Gas prices decreased to $3.32 per gallon in 2013, down slightly from $3.42 in 2012. This minor drop helped ease transportation costs for homebuyers. With slightly lower fuel expenses, potential buyers may have been more open to properties in suburban areas, especially if housing prices were more competitive than in urban locations.
Average 30-Year Fixed Mortgage Rate in 2013
Mortgage rates inched up to 4.16% in 2013 from 3.88% in the prior year. While the increase wasn’t drastic, it may have nudged some homebuyers to act sooner rather than later to secure financing. Homebuyers are encouraged to work with local mortgage loan originators to ensure they understand their borrowing capabilities and can lock in competitive rates with ease.
Curious about today’s mortgage rates and the home you can comfortably afford?
Submit a no-obligation mortgage application today and get pre-approved to determine your budget and take the first step toward homeownership with confidence.
Overview of Differences Between the 2013 and 2012 Real Estate Markets in Celina, Texas.
Total Homes Sold
2012: 184 homes closed.
2013: 180 homes closed, showing a slight decline in transaction volume.
Average Sales Price
2012: $248,066, reflecting slightly higher pricing levels.
2013: $238,224, a modest decrease in average sales price.
Average Days on Market (DOM)
2012: 95 days, indicating slower sales cycles.
2013: 65 days, an improvement showing faster transactions and stronger demand.
Close Price to Listing Price Ratio (ClsPr/LstPr)
2012: 95.64%, highlighting slightly more price negotiation.
2013: 96.28%, reflecting better pricing alignment with buyer expectations.
Average Price per Square Foot
2012: $84.11, lower on average.
2013: $89.23, illustrating property appreciation despite reduced transaction volume.
Homes with Pools
2012: 25 homes included pools, showing higher demand for this amenity.
2013: 19 homes with pools, indicating a slight shift in buyer priorities.
New Construction Homes
2012: 60 new builds, reflecting robust development activity.
2013: 31 new builds, suggesting a slowdown in new home construction.
Most Expensive Property Sold
2012: $1,195,000, a luxury custom home with upscale features on 3.45 acres.
2013: $685,000, a rural estate on 10.45 acres, representing a downward shift in top-end sales values.
Notable Trends and Shifts
- The 2013 market showed greater efficiency with faster sales (lower DOM) and improved close-to-list price ratios.
- There was a subtle decline in both the volume of sales and average pricing, potentially reflecting macroeconomic factors like mortgage rate increases.
- Buyer preferences shifted slightly away from new construction and homes with pools, possibly reflecting changing lifestyle priorities or budget constraints.
- Appreciation in price per square foot underscores the market’s ability to retain value despite reduced high-end activity.
Summary of Real Estate Market Analysis for Celina, TX in 2013
The 2013 Celina, Texas real estate market exhibited a dynamic blend of stability and growth. With solid pricing trends, quicker sales, and a steady demand for diverse property types, it was a pivotal year for buyers and sellers. Both groups had opportunities to achieve their goals, provided they leveraged the right tools, strategies, and expertise.
Homebuyers and First-Time Homebuyers Perspective
For homebuyers, particularly first-time buyers, 2013 presented a competitive but promising landscape. Homes moved quickly, with an average of just 65 days on the market, underscoring the need for preparedness. Securing mortgage pre-approval was a vital first step, ensuring buyers could act decisively when their ideal property came along. Additionally, collaborating with experienced realtors proved invaluable—not only for accessing market insights but also for navigating the complexities of pricing and negotiations. Realtors offered essential guidance, helping buyers secure the right home tailored to their needs and budget.
Home-Sellers Perspective
For home-sellers, the 2013 market underscored the importance of strategic marketing and expert advice. With an average close price to listing price ratio of 96.28%, sellers who priced their homes competitively and worked closely with realtors experienced smoother transactions. Realtors played a critical role in crafting tailored marketing strategies, leveraging networks, and advising on property presentation to attract buyers. These efforts were essential in achieving timely sales, particularly for higher-end or niche properties, such as rural estates.
Final Thoughts
Both homebuyers and home sellers benefited from proactive approach in the 2013 Celina real estate market. For buyers, understanding the importance of financial preparedness and working with trusted professionals shaped their success. For sellers, leveraging the expertise of realtors enabled efficient and profitable outcomes. The year’s market clearly demonstrated the power of knowledge, preparation, and collaboration in driving successful real estate experiences for all participants.
Why Historical Statistical Data Matters in the Celina, Texas Real Estate Market
Did you know that Appraisers and Realtors rely on historical statistical data to determine a property’s current value?
The information presented above is just a small glimpse into the wealth of essential data available to help both homebuyers and sellers set realistic expectations and gain an initial understanding of the real estate market in Celina, Texas. Real estate transactions are intricate, and what you see here is merely a sample of the many factors at play in each deal in this city.
Beyond these insights, a comprehensive analysis is available that focuses on specific aspects like zip codes, neighborhoods, and homes within certain school districts in Celina. This granular data dives deeper into market trends, allowing for a precise understanding of local dynamics. Additionally, historical data plays a critical role in crafting informed strategies, providing the context needed to make confident decisions that align with your goals.
Unlock Exceptional Service!
Assistance with all your real estate needs in the Dallas-Fort Worth area is just a click or call away. Reach out at 214-940-8149 or connect through the links below.
Meet Your Trusted Realtor and Mortgage Expert in Celina, Texas!
Greetings! I’m Oleg Sedletsky, and I’m excited to introduce myself as your go-to full-time licensed Texas REALTOR® and Mortgage Loan Originator.
I proudly represent JPAR® – Real Estate Brokerage as a REALTOR® and Utopia Mortgage LLC as a Mortgage Loan Originator! My designations and certifications reflect my dedication to helping you achieve your real estate goals in CELINA, TX and other locations in the vibrant Dallas-Fort Worth area!
Whether you’re a homebuyer or a home seller, the information on this page highlights just a fraction of what’s important to know about the Celina, TX real estate market. Data like this is key to understanding trends, making informed decisions, and achieving your real estate goals.
The good news? I can provide much more. When you choose me as your real estate agent, you’ll gain access to detailed neighborhood analyses, historical trends, and everything you need to make confident decisions. Whether you’re buying your dream home or securing the best deal on a sale, I’ll guide you every step of the way with peace of mind.
I’d love to be your trusted advisor in this exciting journey. With a commitment to ongoing professional development, I’m always improving to serve you better. Plus, I’m fluent in English, Ukrainian, and Russian and ready to help whenever you’re ready.
If you’re looking for a dedicated, experienced professional, contact me today!
It’s All About You and Your Real Estate Goals!
My mission is to serve you! With my knowledge and expertise, I’m here to help you achieve all your real estate goals!
I’m passionate about helping homebuyers and home-sellers navigate the exciting real estate landscape in Celina, Texas! Whether you’re searching for your dream home, exploring land options, or looking for commercial properties, my Real Estate Services have you covered.
Contact me today for all your real estate needs in Celina, Texas! Call/text 214-940-8149
A Comprehensive Analysis of Single-Family Residential Housing Market in Celina, TX: 2010 to Present
Discover the trends, stats, and insights shaping Celina’s real estate market year by year!
2010-2020
Celina, TX Real Estate Market Report 2010: Analysis and Trends
Celina, TX Real Estate Market Report 2011: Analysis and Trends
Celina, TX Real Estate Market Report 2012: Analysis and Trends
Celina, TX Real Estate Market Report 2013: Analysis and Trends
Celina, TX Real Estate Market Report 2014: Analysis and Trends
Celina, TX Real Estate Market Report 2015: Analysis and Trends
Celina, TX Real Estate Market Report 2016: Analysis and Trends
Celina, TX Real Estate Market Report 2017: Analysis and Trends
Celina, TX Real Estate Market Report 2018: Analysis and Trends
Celina, TX Real Estate Market Report 2019: Analysis and Trends
Celina, TX Real Estate Market Report 2020: Analysis and Trends
This market analysis is intended solely for educational purposes. This market analysis is based on data sourced from NTREIS, Inc. This analysis is exclusively focused on single-family homes and does not account for other property types. The total number of real estate transactions within the specified period and location may vary. Data accuracy cannot be guaranteed due to potential input errors made by NTREIS users. This market analysis does not account for all new construction home sales. If you need detailed information about recorded property sales or other public records, please contact the appropriate city or county office.