
Lucas, TX Real Estate: A Comprehensive Analysis of the 2007 Single-Family Residential Housing Market
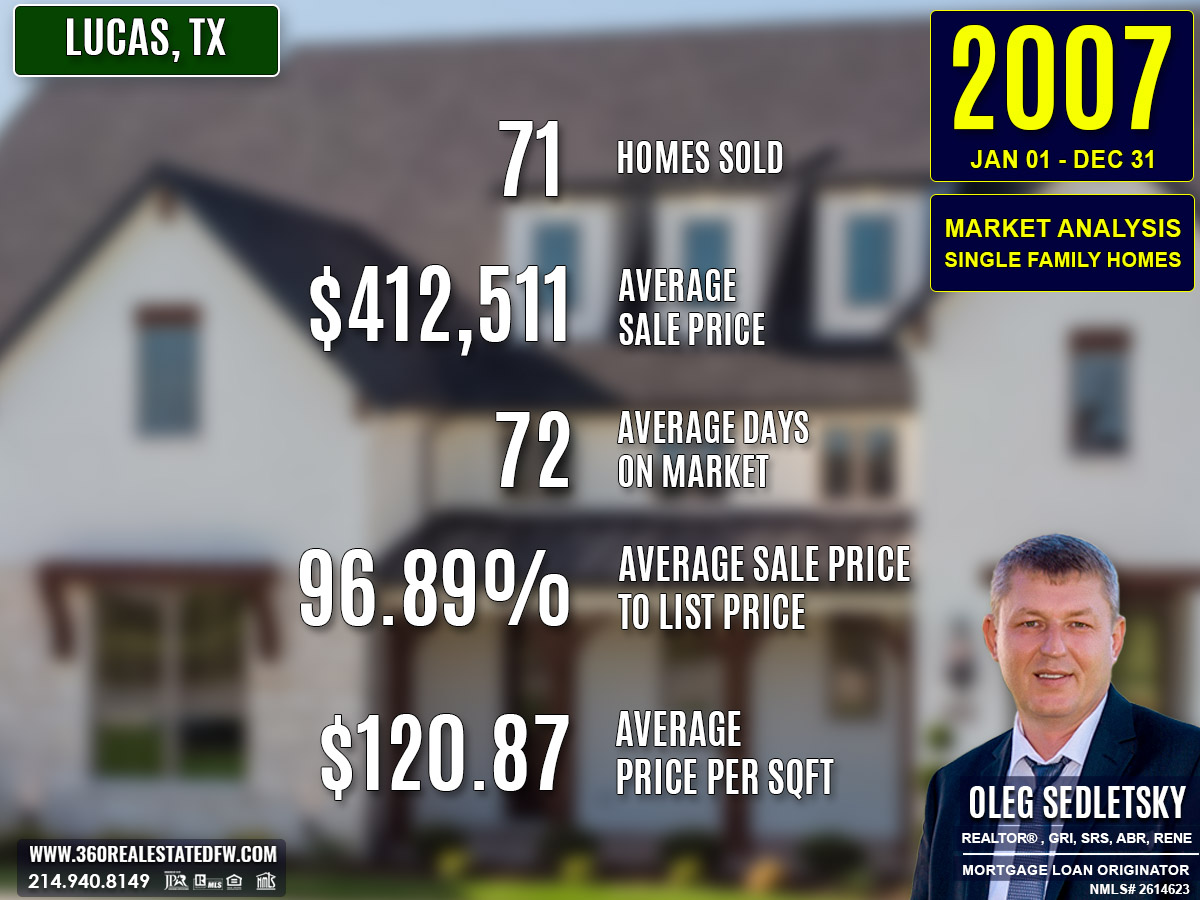
The 2007 real estate market in Lucas, TX showcased resilience and growth, balancing affordability, luxury, and efficiency. With 71 homes sold, the year highlighted a market dynamic characterized by a steady pace, increasing property values, and broad buyer interest across diverse segments. Despite economic fluctuations, the market maintained its appeal with strategic pricing and high-quality offerings.
Key Takeaways and Trends from Lucas’s 2007 Real Estate Market
Pricing Range: The 2007 market spanned from $96,900 to $989,000, offering attractive entry points alongside robust luxury options. Both the increased average price and price per square foot emphasized growing value and buyer willingness to invest.
Market Efficiency: A faster average DOM (72 days) and improved ClsPr/LstPr and OLP ratios showcased a competitive and efficiently functioning market during the year.
Unique Outliers: The most expensive home achieved a new high in recent years, while the reduction in new construction (down to just 8 homes) shifted focus toward resales and unique high-end properties.
Mortgage Rates Impact: Despite the mortgage rate of 6.40%, slightly lower than in 2006, the market experienced growth in mid-range and luxury segments, maintaining balance and resilience against economic changes.
Total Homes Closed
A total of 71 homes closed during 2007, slightly fewer than the prior year but indicative of continued buyer activity. A notable 24 homes featured pools, underscoring the ongoing popularity of lifestyle-oriented amenities. Meanwhile, 8 newly constructed homes entered the market, reflecting a decline in new developments compared to the prior year.
Property Pricing Insights
The property prices in 2007 reflected both affordability and luxury, with clear growth in overall value:
- Minimum Price: $96,900
- Maximum Price: $989,000
- Average Price: $412,511
- Median Price: $364,000
The increased maximum price and rising average price signaled a growing interest in upscale homes, while the low minimum price allowed entry-level opportunities for buyers.
Property Size and Features
The 2007 market offered a range of configurations:
- Bedrooms: Most homes included 3 to 7 bedrooms, with an average of 4 bedrooms.
- Bathrooms: Properties had between 2 and 6 bathrooms, averaging 4 bathrooms.
- Square Footage: Homes varied in size from 1,380 sq. ft. to 6,823 sq. ft., with an average of 3,224 sq. ft..
- Lot Sizes: Lot areas ranged from 0 acres to 7.350 acres, with an average of 1.992 acres, appealing to buyers seeking either compact or expansive homes.
Market Dynamics
Market efficiency improved in 2007, with homes selling faster and more competitively:
- Days on Market (DOM): The average DOM was 72 days, down from 85 days in 2006, indicating quicker sales.
- ClsPr/LstPr Ratio: Homes closed at 96.89% of their listed price, showing limited negotiation leeway.
- ClsPr/OLP Ratio: The average ClsPr/OLP was 95.90%, reflecting stable market conditions.
- Price per Square Foot: The average price per sq. ft. rose to $120.87, signaling added value for properties.
Insights into the Most Expensive Lucas, TX Property Sold in 2007
The most expensive property sold in Lucas, Texas in 2007 was a luxurious standout, showcasing elegance and efficiency. The home fetched a premium price of $989,000, reflecting its high value and unique features. With its 4,860 sq. ft. living space and a lot spanning 3.930 acres, this property embodied luxury while being competitively priced at $203.50 per square foot. Its quick sale, completed in just 20 days, emphasized strong demand in the high-end market.
Below are the key metrics of this impressive property:
- Price: $989,000
- Beds/Baths: 4 bedrooms, 4 bathrooms
- Square Footage: 4,860 sq. ft.
- Price per Square Foot: $203.50
- Lot Size Area: 3.930 acres
- Days on Market (DOM): 20 days
- ClsPr/LstPr Ratio: 100.00%
- ClsPr/OLP Ratio: 100.00%
- Year Built: 2000
This property set a new benchmark for premium listings in 2007, appealing both in design and value.
Economic context
Average Electricity Costs in Dallas-Fort Worth in 2007
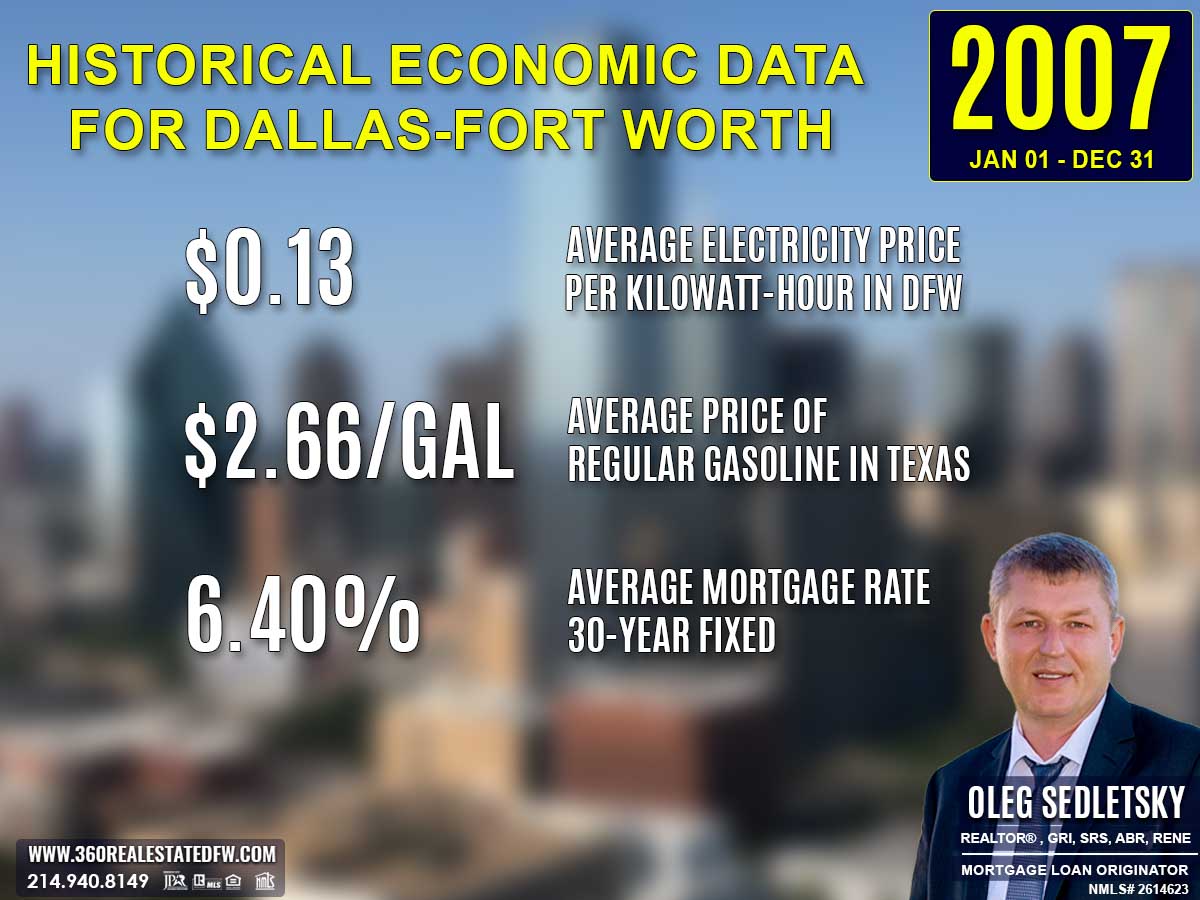
Electricity prices held steady at $0.13 per kilowatt-hour in 2007, unmoved from the prior year. Stability in this area likely eased financial stress for households already grappling with rising costs in other sectors, such as fuel and mortgage rates. A flat rate provided predictability for budgeting utility expenses.
Average Price for Regular Gasoline in Texas in 2007
Gas prices inched up to $2.66 per gallon in 2007, compared to the $2.47 recorded in 2006. This continued upward trend likely heightened the appeal of homes closer to urban centers or near public transportation, where travel expenses could be kept under control. homebuyers may have increasingly evaluated fuel efficiency in their decision-making processes.
Average 30-Year Fixed Mortgage Rate in 2007
The average 30-year fixed mortgage rate slightly dipped to 6.40% from 6.47% in 2006. Despite the minor decrease, rates remained elevated and continued to weigh on affordability. Obtaining pre-approval from a local mortgage loan originator became a critical step for homebuyers aiming to strengthen their purchasing power amid fluctuating rates.
Curious about today’s mortgage rates and the home you can comfortably afford?
Submit a no-obligation mortgage application today and get pre-approved to determine your budget and take the first step toward homeownership with confidence.
Overview of Differences Between the 2006 and 2007 Real Estate Markets in Lucas, Texas
The comparison between Lucas’s 2006 and 2007 real estate markets reveals notable variances in sales activity, pricing, property configurations, and market dynamics:
Total Homes Sold
Sales slightly declined, with 74 homes sold in 2006 compared to 71 homes in 2007, reflecting a slight dip in market activity.
Pricing
- The minimum price decreased significantly from $175,000 in 2006 to $96,900 in 2007, illustrating greater affordability and more entry-level options in the market.
- The maximum price increased from $850,000 in 2006 to $989,000 in 2007, indicating stronger activity in the luxury market segment.
- Both the average price ($412,511) and median price ($364,000) rose compared to 2006, signaling overall price growth.
- The price per square foot increased slightly from an average of $116.48 in 2006 to $120.87 in 2007, reflecting increasing property values.
Property Features
- Bedrooms and bathrooms configurations expanded, with homes offering up to 7 bedrooms and 6 bathrooms in 2007 compared to a maximum of 5 bedrooms and bathrooms in 2006.
- Square footage saw an increase in the maximum size, reaching 6,823 sq. ft. in 2007, up from 5,614 sq. ft. in 2006. However, the average size declined slightly to 3,224 sq. ft., suggesting fewer large-scale homes sold.
- Lot size decreased overall, with the largest properties shrinking from 11.877 acres in 2006 to 7.350 acres in 2007.
Market Dynamics
- Days on Market (DOM): The average DOM improved from 85 days in 2006 to 72 days in 2007, highlighting a quicker sales process.
- ClsPr/LstPr Ratio: The ratio increased to 96.89% in 2007, up from 96.58% in 2006, showing more competitive offers closer to the asking price.
- ClsPr/OLP Ratio: This metric also saw growth, with 95.90% in 2007 compared to 95.01% in 2006, suggesting greater pricing alignment and stable demand.
Trends and Outliers
The number of homes sold with a pool saw a slight decrease, dropping from 26 in 2006 to 24 in 2007, reflecting a steady demand for leisure-focused properties.
New construction homes fell from 16 in 2006 to just 8 in 2007, pointing to reduced building activity.
The most expensive property in 2007 sold for $989,000, a notable increase over the most expensive sale in 2006 ($850,000), highlighting the growing demand for high-end luxury properties.
Economic Context
The average mortgage rate slightly declined from 6.47% in 2006 to 6.40% in 2007, providing slight relief amidst rising home prices, which may have supported continued mid-range and luxury segment growth.
Key Differences
The 2007 market reflected a dynamic yet evolving mix of affordability and luxury. Rising property values and faster turnover paired with reduced new construction homes suggest buyers were more focused on existing homes in diverse price ranges. Expanded luxury offerings and continued competitiveness ensured the Lucas, Texas market’s vibrancy amidst economic fluctuations.
Summary of Real Estate Market Analysis for Lucas, TX in 2007
The 2007 real estate market in Lucas, TX, demonstrated remarkable versatility, maintaining a balance between affordability and luxury while achieving robust sales efficiency. With diverse offerings ranging from entry-level homes to expansive luxury estates, the market catered to a wide demographic of buyers. Rising property values, coupled with faster sales cycles, highlighted strong demand and strategic pricing efforts.
Despite a dip in new construction homes, the sustained popularity of pool-equipped properties and high-end sales reinforced buyer confidence in the market’s offerings. The slightly reduced mortgage rates added a layer of accessibility, ensuring that Lucas, TX, continued to appeal as both a residential haven and an investment opportunity.
Overall, 2007 marked a year of growth, stability, and opportunity for the Lucas, TX, real estate market, securing its position as a dynamic and thriving marketplace.
The Importance of Statistical Data in Lucas, Texas Real Estate Market
Did you know that appraisers and Realtors rely on historical statistical data to determine a property’s current value?
Analyzing historical market data is essential for making informed decisions in today’s real estate market. Examining past trends provides valuable insights that facilitate accurate pricing, more strategic negotiations, and a comprehensive understanding of market dynamics.
Unlock Exceptional Service!
Assistance with all your real estate needs in the Dallas-Fort Worth area is just a click or call away. Reach out at 214-940-8149 or connect through the links below.

Greetings! I’m Oleg Sedletsky, and I’m excited to introduce myself as your go-to full-time licensed Texas REALTOR® and Mortgage Loan Originator.
I proudly represent JPAR® – Real Estate Brokerage as a REALTOR® and Utopia Mortgage LLC as a Mortgage Loan Originator! My designations and certifications reflect my dedication to helping you achieve your real estate goals in Lucas, TX and other locations in the vibrant Dallas-Fort Worth area!
My commitment to ongoing professional development means I’m always enhancing my skills to serve you better. You can count on me as your trusted expert throughout your real estate journey. Plus, I’m fluent in English, Ukrainian, and Russian and ready to assist you every step of the way!
It’s All About You and Your Real Estate Goals!
My mission is to serve you! With my knowledge and expertise, I’m here to help you achieve all your real estate goals!
I’m passionate about helping buyers and sellers navigate the exciting real estate landscape in Lucas, Texas! Whether you’re searching for your dream home, exploring land options, or looking for commercial properties, my Real Estate Services have you covered.
Contact me today for all your real estate needs in Lucas, Texas! Call/text 214-940-8149

A Comprehensive Analysis of Single-Family Residential Housing Market in Lucas, TX: 2003 to Present
2003-2010
Lucas, TX Real Estate Market Report 2003: Analysis and Trends
Lucas, TX Real Estate Market Report 2004: Analysis and Trends
Lucas, TX Real Estate Market Report 2005: Analysis and Trends
Lucas, TX Real Estate Market Report 2006: Analysis and Trends
Lucas, TX Real Estate Market Report 2007: Analysis and Trends
Lucas, TX Real Estate Market Report 2008: Analysis and Trends
Lucas, TX Real Estate Market Report 2009: Analysis and Trends
Lucas, TX Real Estate Market Report 2010: Analysis and Trends
2011-2020
Lucas, TX Real Estate Market Report 2011: Analysis and Trends
Lucas, TX Real Estate Market Report 2012: Analysis and Trends
Lucas, TX Real Estate Market Report 2013: Analysis and Trends
Lucas, TX Real Estate Market Report 2014: Analysis and Trends
Lucas, TX Real Estate Market Report 2015: Analysis and Trends
Lucas, TX Real Estate Market Report 2016: Analysis and Trends
Lucas, TX Real Estate Market Report 2017: Analysis and Trends
Lucas, TX Real Estate Market Report 2018: Analysis and Trends
Lucas, TX Real Estate Market Report 2019: Analysis and Trends
Lucas, TX Real Estate Market Report 2020: Analysis and Trends
This market analysis is intended solely for educational purposes. This market analysis is based on data sourced from NTREIS, Inc. This analysis is exclusively focused on single-family homes and does not account for other property types. The total number of real estate transactions within the specified period and location may vary. Data accuracy cannot be guaranteed due to potential input errors made by NTREIS users. This market analysis does not account for all new construction home sales. If you need detailed information about recorded property sales or other public records, please contact the appropriate city or county office.
Lucas, TX Real Estate: A Comprehensive Analysis of the 2006 Single-Family Residential Housing Market
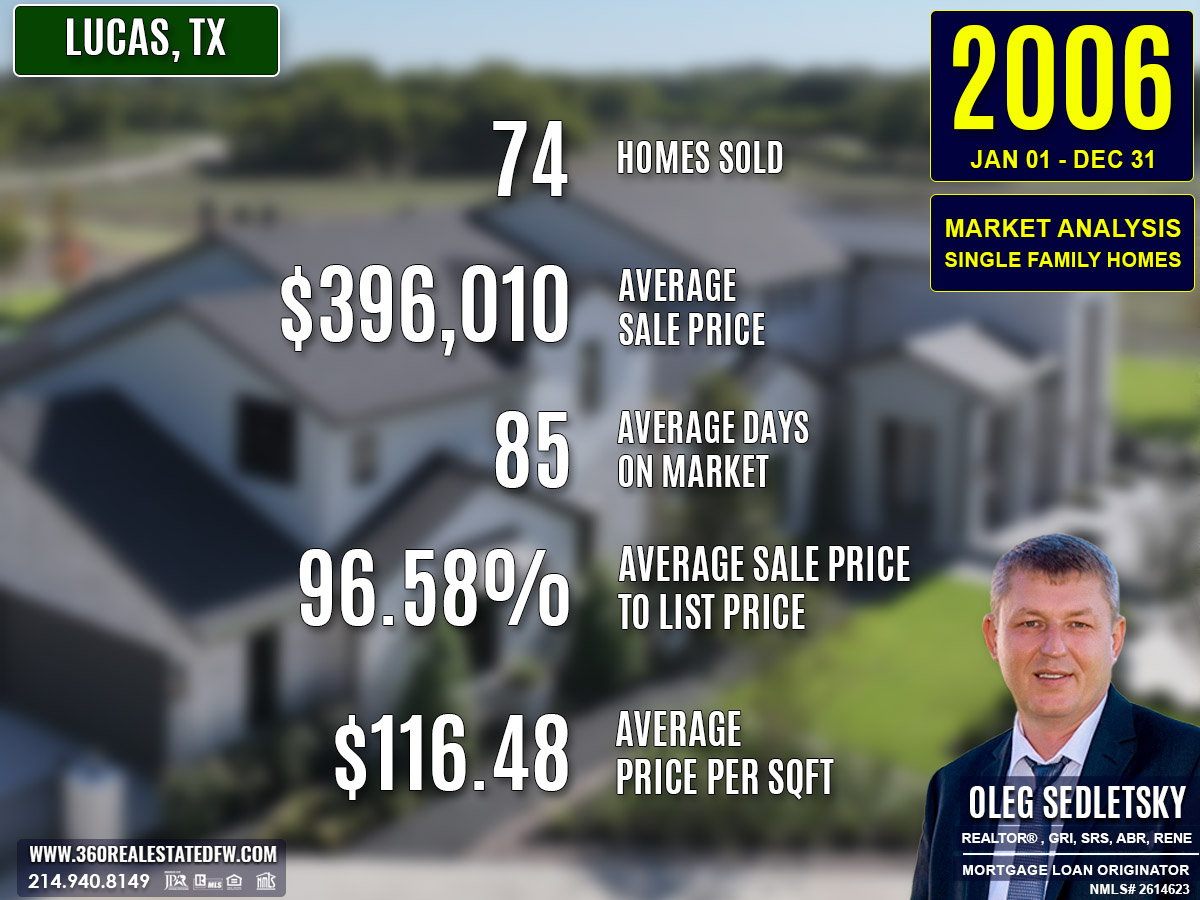
The 2006 real estate market in Lucas, TX experienced steady activity and continual progress in adapting to buyer trends. A total of 74 homes closed, showcasing diverse offerings that appealed to a mix of buyers. Despite a rise in mortgage rates to 6.47%, the market remained resilient, balancing affordability and innovation with competitive pricing and enhanced leisure-oriented properties.
Key Takeaways and Trends from Lucas’s 2006 Real Estate Market
Pricing Range: The minimum home price increased notably, while the maximum price saw a slight drop. However, the rise in average price and price per square foot suggests that buyers were willing to invest in value-driven properties.
Market Efficiency: The shorter DOM (from 91 days in 2005 to 85 days in 2006) pointed to a more active and responsive market. Improved ClsPr/LstPr ratios underscored strong buyer demand coupled with precise pricing by sellers.
Unique Outliers: Properties with luxury features like pools saw higher demand, contributing to an increase in the total count of pool homes. The most expensive property illustrated elite appeal without a sharp price inflation, retaining competitive per-square-foot value.
Mortgage Rates Impact: While mortgage rates climbed to 6.47%, demand for mid-range and premium homes persisted, likely influenced by Lucas’s appeal as a balanced, desirable locale.
Total Homes Closed
The real estate market recorded 74 closed transactions during 2006. Among these, the demand for recreational features was evident, as 26 homes boasted pools, reflecting heightened buyer interest in leisure amenities. Additionally, 16 homes were newly constructed, demonstrating an ongoing effort to meet the demand for modern design and convenience despite economic pressures.
Property Pricing Insights
Lucas’s real estate market in 2006 exhibited a broad price distribution:
- Minimum Price: $175,000
- Maximum Price: $850,000
- Average Price: $396,010
- Median Price: $349,900
This pricing spectrum highlighted healthy activity across both mid-range and luxury segments. The increase in minimum price and average price from the prior year indicated sustained buyer focus on higher-quality homes.
Property Size and Features
There was tangible diversity in property configurations, serving different buyer needs:
- Bedrooms: Properties featured between 3 and 5 bedrooms, with an average of 4 bedrooms.
- Bathrooms: Homes ranged from 2 to 6 bathrooms, averaging 3.
- Square Footage: Living spaces varied significantly, from 1,380 sq. ft. to 5,614 sq. ft., with an average size of 3,336 sq. ft..
- Lot Sizes: Property lots spanned from 0 acres (in townhomes or compact developments) to 11.877 acres, with an average of 2.159 acres.
Market Dynamics
The market saw improved efficiency alongside pricing stabilization:
- Days on Market (DOM): Homes averaged 85 days on the market, a drop reflecting quicker turnover compared to the prior year.
- ClsPr/LstPr Ratio: Closing prices averaged 96.58% of listing prices, showing limited negotiation room.
- ClsPr/OLP Ratio: Closing prices stood at an average of 95.01% of original listing prices, indicating consistent pricing strategies.
- Price per Square Foot: The average price per sq. ft. reached $116.48, showcasing increased market value for space.
Insights into the Most Expensive Lucas, TX Property Sold in 2006
The most expensive property sold in Lucas, TX during 2006 was a luxurious and spacious home that balanced elegance with functionality. Priced at $850,000, this stunning residence offered an upscale lifestyle within its 4,509 sq. ft. living space and featured premium amenities. Despite its high value, the property remained competitively priced at $188.51 per square foot, underscoring its appeal.
Highlights of this remarkable home include:
- Price: $850,000
- Beds/Baths: 4 bedrooms, 4 bathrooms
- Square Footage: 4,509 sq. ft.
- Price per Sq. Ft.: $188.51
- Lot Size Area: 2.360 acres
- Days on Market (DOM): 149
- ClsPr/LstPr Ratio: 92.39%
- ClsPr/OLP Ratio: 92.39%
- Year Built: 1999
This property exemplified the high-end offerings of the 2006 Lucas, TX real estate market, combining sophisticated design, spacious living, and favorable per-square-foot value.
Economic context
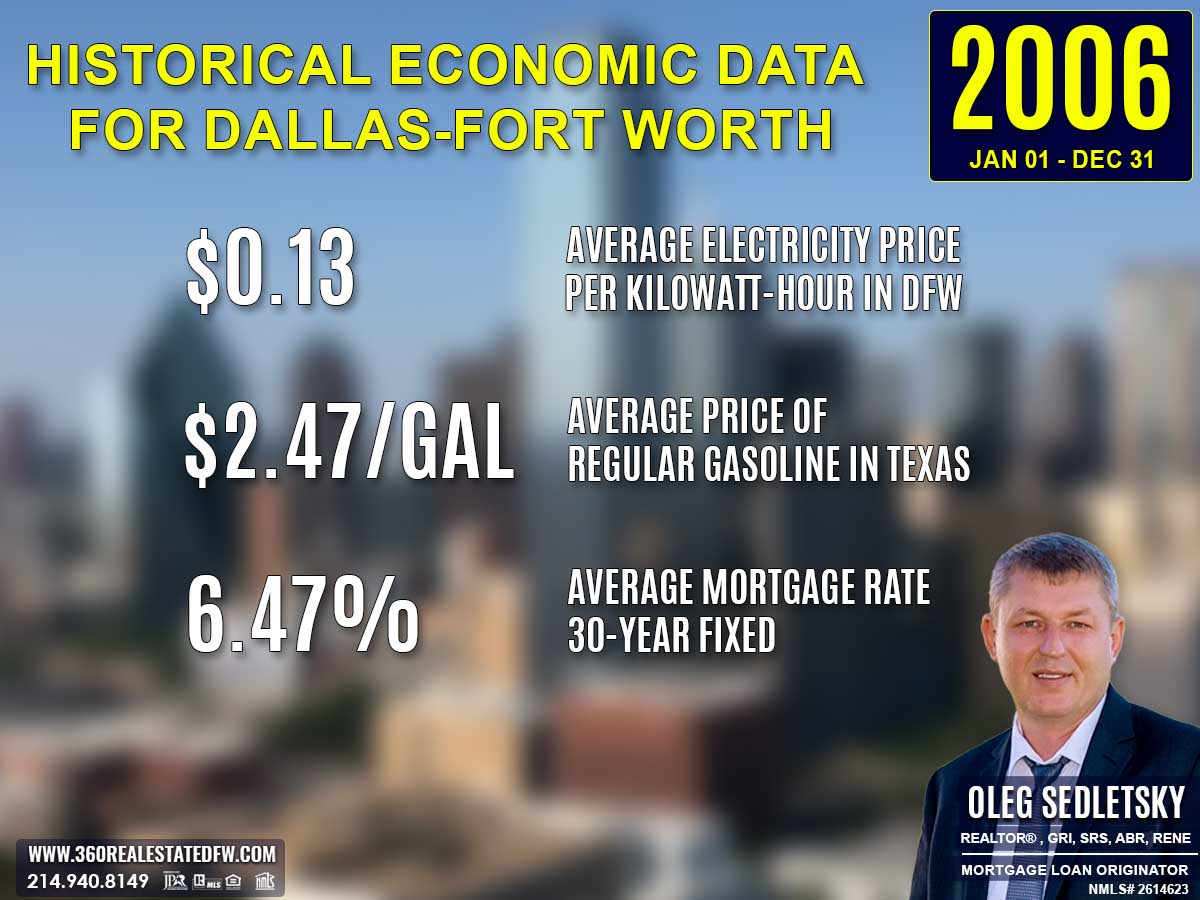
Average Electricity Costs in Dallas-Fort Worth in 2006
Electricity prices climbed to $0.13 per kilowatt-hour in 2006, up from $0.11 the previous year. This rise marked a more noticeable spike in energy costs, which may have influenced homebuyers to prioritize energy-efficient homes. Properties with modern insulation or solar panels likely gained appeal as households sought to manage mounting utility bills.
Average Price for Regular Gasoline in Texas in 2006
Gas prices increased again, reaching $2.47 per gallon in 2006, up from $2.18 in 2005. With fuel costs steadily creeping higher, proximity to essential services, public transit, and workplaces became an even more significant factor in the home-buying process. Homebuyers may have placed higher value on walk-friendly neighborhoods or shorter commute times.
Average 30-Year Fixed Mortgage Rate in 2006
Mortgage rates reached 6.47% in 2006, up from 5.93% in 2005. This higher rate tightened affordability and may have dampened market activity, particularly for first-time buyers. Homebuyers were encouraged to work closely with local mortgage loan originators to lock in competitive rates and ensure they understood the financing options available to them.
Curious about today’s mortgage rates and the home you can comfortably afford?
Submit a no-obligation mortgage application today and get pre-approved to determine your budget and take the first step toward homeownership with confidence.
Overview of Differences Between the 2005 and 2006 Real Estate Markets in Lucas, Texas
The real estate market in Lucas, TX witnessed notable changes between 2005 and 2006, showcasing shifts in pricing, property features, and market dynamics.
Total Homes Sold
A slight dip occurred as the number of homes sold decreased from 75 in 2005 to 74 in 2006, signaling marginally reduced buyer activity.
Property Pricing
The minimum price increased significantly from $49,000 in 2005 to $175,000 in 2006, revealing a shift in affordability thresholds.
The maximum price declined slightly from $865,000 in 2005 to $850,000 in 2006, suggesting a stabilization in the luxury segment.
Both the average sales price (rising to $396,010) and median price (increasing to $349,900) indicated overall growth in mid-range sales.
The price per square foot rose from an average of $106.15 in 2005 to $116.48 in 2006, reflecting increased pricing efficiency.
Property Size and Features
While square footage of the largest homes decreased (from 8,260 sq. ft. in 2005 to 5,614 sq. ft. in 2006), the average size increased slightly to 3,336 sq. ft., indicating robust mid-range property sales.
Lot size for the highest acreage property reduced (from 16.46 acres to 11.877 acres), and the average lot size experienced a minor decline.
Market Dynamics
Homes sold faster on average, with DOM declining from 91 days in 2005 to 85 days in 2006, reflecting a more efficient market.
The ClsPr/LstPr ratio improved slightly to 96.58% in 2006, up from 96.46% in 2005, showcasing tighter negotiations.
The ClsPr/OLP ratio also increased, moving from 94.51% to 95.01%, reinforcing pricing stability.
Unique Outliers and Trends
The most expensive property sold in 2006—priced at $850,000—boasted high-end amenities with a more competitive price per square foot ($188.51) compared to 2005’s luxury sale, highlighting continued demand for premium properties despite their lower price ceilings.
The total homes with pools rose to 26 in 2006 from 22 in 2005, while new construction homes rebounded to 16 compared to the previous year’s 12.
Economic Influence
Mortgage rates increased to 6.47% in 2006, up from 5.93% in 2005, which may have influenced affordability and higher starting prices for buyers.
Key Differences
2006 real estate market in Lucas, TX underlined a move towards pricing stability and refined demand, with rising price trends for mid-tier properties offsetting adjustments in the luxury segment. Improvements in market responsiveness and competitive pricing contributed to a balanced yet evolving real estate environment.
Summary of Real Estate Market Analysis for Lucas, TX in 2006
The 2006 real estate market in Lucas, TX, reflected a remarkable balance of diversity and opportunity, catering to a wide spectrum of buyers. With competitive pricing strategies, rising property values, and a stronger focus on lifestyle-oriented features like pools, the market demonstrated resilience in the face of economic shifts, such as higher mortgage rates. The steady increase in average and median prices, along with improved market efficiency, underscored the growing demand for mid-tier and higher-end homes. Additionally, the inclusion of new constructions and expansive luxury estates highlighted Lucas’s ability to provide modernity and exclusivity.
The Importance of Statistical Data in Lucas, Texas Real Estate Market
Did you know that appraisers and Realtors rely on historical statistical data to determine a property’s current value?
Analyzing historical market data is essential for making informed decisions in today’s real estate market. Examining past trends provides valuable insights that facilitate accurate pricing, more strategic negotiations, and a comprehensive understanding of market dynamics.
Unlock Exceptional Service!
Assistance with all your real estate needs in the Dallas-Fort Worth area is just a click or call away. Reach out at 214-940-8149 or connect through the links below.
Greetings! I’m Oleg Sedletsky, and I’m excited to introduce myself as your go-to full-time licensed Texas REALTOR® and Mortgage Loan Originator.
I proudly represent JPAR® – Real Estate Brokerage as a REALTOR® and Utopia Mortgage LLC as a Mortgage Loan Originator! My designations and certifications reflect my dedication to helping you achieve your real estate goals in Lucas, TX and other locations in the vibrant Dallas-Fort Worth area!
My commitment to ongoing professional development means I’m always enhancing my skills to serve you better. You can count on me as your trusted expert throughout your real estate journey. Plus, I’m fluent in English, Ukrainian, and Russian and ready to assist you every step of the way!
It’s All About You and Your Real Estate Goals!
My mission is to serve you! With my knowledge and expertise, I’m here to help you achieve all your real estate goals!
I’m passionate about helping buyers and sellers navigate the exciting real estate landscape in Lucas, Texas! Whether you’re searching for your dream home, exploring land options, or looking for commercial properties, my Real Estate Services have you covered.
Contact me today for all your real estate needs in Lucas, Texas! Call/text 214-940-8149
A Comprehensive Analysis of Single-Family Residential Housing Market in Lucas, TX: 2003 to Present
2003-2010
Lucas, TX Real Estate Market Report 2003: Analysis and Trends
Lucas, TX Real Estate Market Report 2004: Analysis and Trends
Lucas, TX Real Estate Market Report 2005: Analysis and Trends
Lucas, TX Real Estate Market Report 2006: Analysis and Trends
Lucas, TX Real Estate Market Report 2007: Analysis and Trends
Lucas, TX Real Estate Market Report 2008: Analysis and Trends
Lucas, TX Real Estate Market Report 2009: Analysis and Trends
Lucas, TX Real Estate Market Report 2010: Analysis and Trends
2011-2020
Lucas, TX Real Estate Market Report 2011: Analysis and Trends
Lucas, TX Real Estate Market Report 2012: Analysis and Trends
Lucas, TX Real Estate Market Report 2013: Analysis and Trends
Lucas, TX Real Estate Market Report 2014: Analysis and Trends
Lucas, TX Real Estate Market Report 2015: Analysis and Trends
Lucas, TX Real Estate Market Report 2016: Analysis and Trends
Lucas, TX Real Estate Market Report 2017: Analysis and Trends
Lucas, TX Real Estate Market Report 2018: Analysis and Trends
Lucas, TX Real Estate Market Report 2019: Analysis and Trends
Lucas, TX Real Estate Market Report 2020: Analysis and Trends
This market analysis is intended solely for educational purposes. This market analysis is based on data sourced from NTREIS, Inc. This analysis is exclusively focused on single-family homes and does not account for other property types. The total number of real estate transactions within the specified period and location may vary. Data accuracy cannot be guaranteed due to potential input errors made by NTREIS users. This market analysis does not account for all new construction home sales. If you need detailed information about recorded property sales or other public records, please contact the appropriate city or county office.
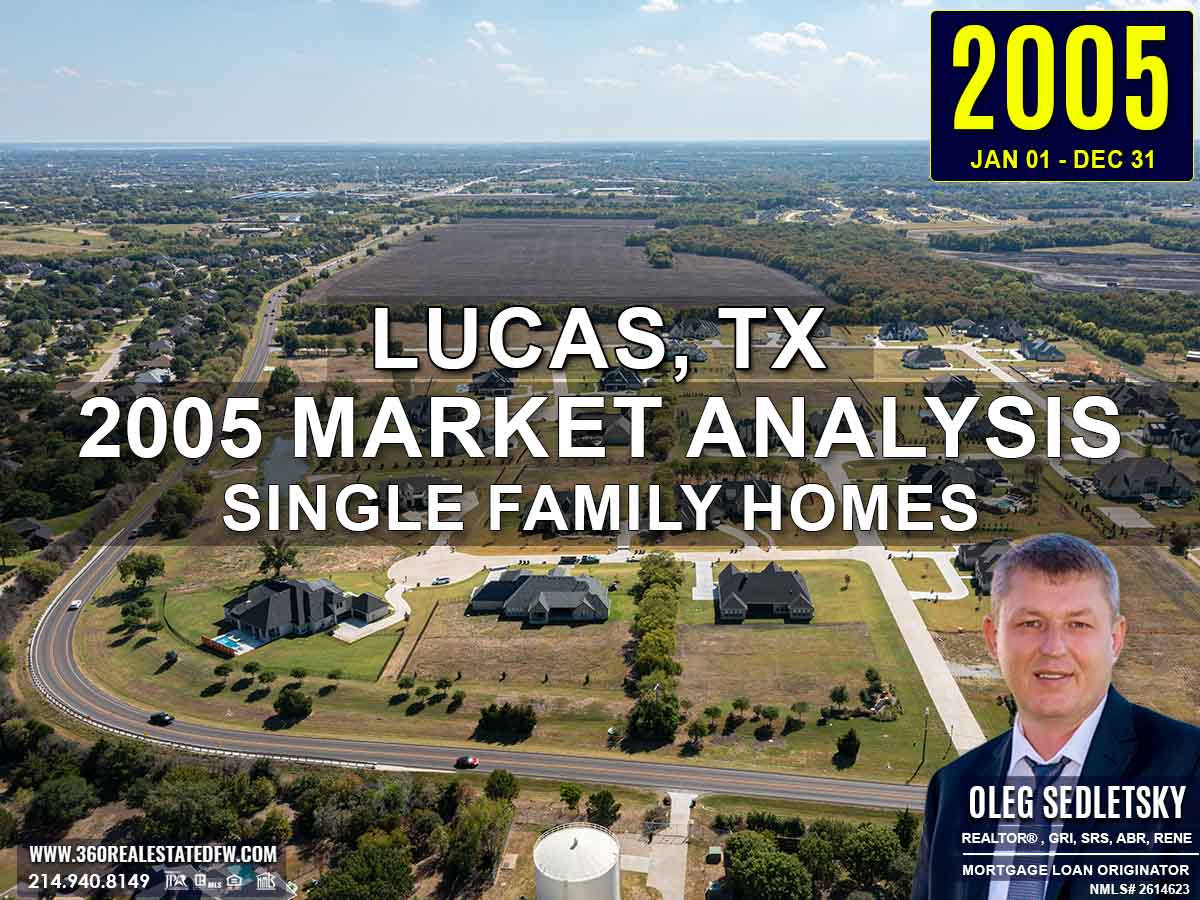
Lucas, TX Real Estate: A Comprehensive Analysis of the 2005 Single-Family Residential Housing Market
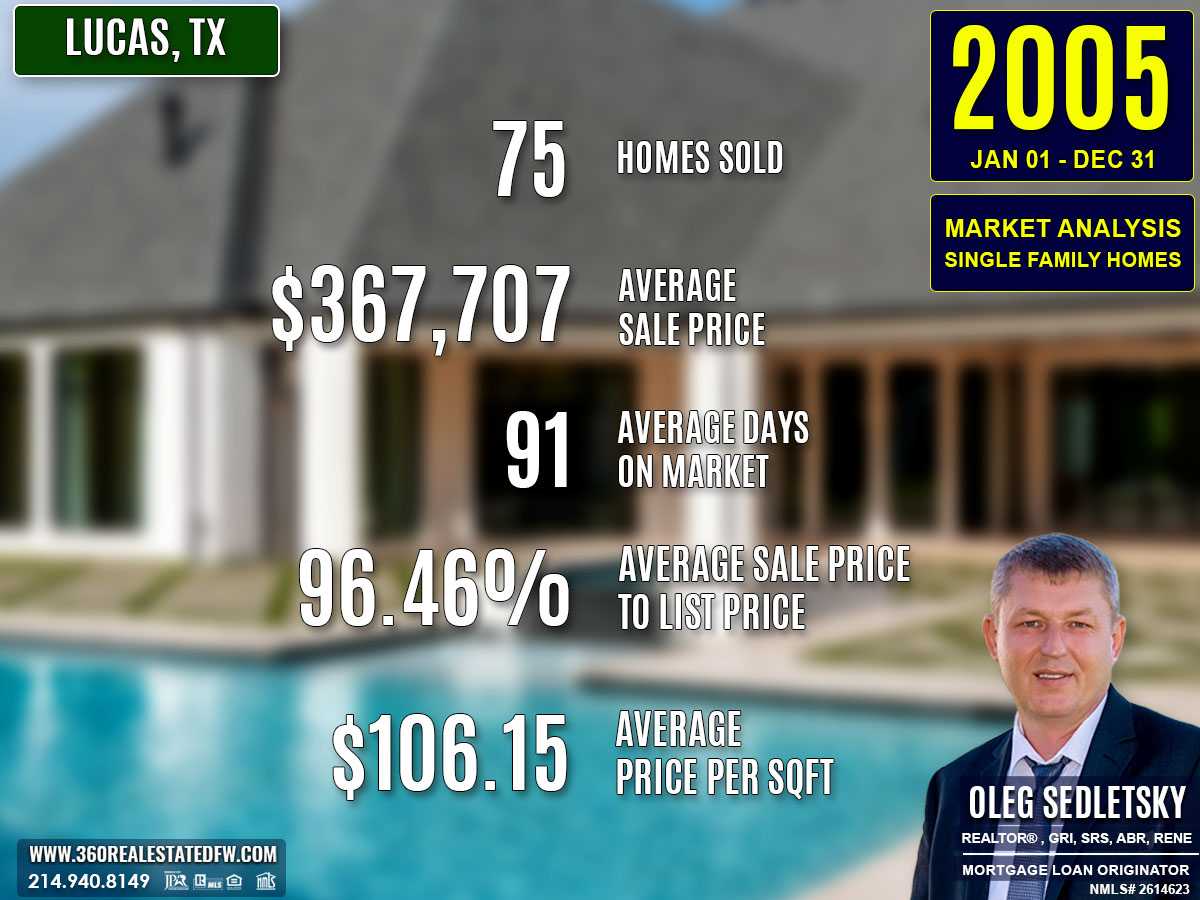
The 2005 real estate market in Lucas, TX demonstrated increased activity and evolving dynamics. With 75 homes closed, the market reflected solid demand across different price ranges. While luxury homes continued to appeal to buyers, affordability and faster sales turnover marked key highlights for the year. Despite slight increases in mortgage rates, market engagement remained strong, maintaining the city’s growth trajectory.
Key Takeaways and Trends from Lucas’s 2005 Real Estate Market
Pricing Range: The broad pricing range between $49,000 and $865,000 satisfied diverse buyer demographics, with increased interest in middle and high-end properties reflected in the average and median price metrics.
Market Efficiency: The average DOM dropped significantly, showing that homes sold faster, and the higher ClsPr/LstPr ratio reflected tighter negotiations.
Unique Outliers: The most expensive property stood out not only for its price but also for its extended time on the market, suggesting luxury homes required specific buyers.
Mortgage Rates Impact: A slight mortgage rate increase to 5.93% did little to deter buyers, evidenced by stronger sales turnover and willingness to close near listing prices.
Total Homes Closed
A total of 75 homes were successfully sold in 2005, further showcasing the market’s activity growth from the previous year. Among these properties, 22 homes included pools, catering to buyers seeking lifestyle enhancements such as leisure and relaxation. Additionally, 12 homes were new builds, offering contemporary features, although this number was lower compared to prior years.
Property Pricing Insights
- Minimum Price: $49,000
- Maximum Price: $865,000
- Average Price: $367,707
- Median Price: $335,500
The pricing trends highlighted a broad market appeal, with affordability emphasized at entry-level tiers and luxury homes setting the high end of the market spectrum.
Property Size and Features
The homes sold in 2005 reflected diverse property offerings across size and configuration brackets.
- Bedrooms: Properties offered between 3 and 6 bedrooms, averaging 4 bedrooms.
- Bathrooms: Homes included 2 to 6 bathrooms, with an average of 3 baths.
- Square Footage: Homes varied significantly, ranging from a compact 1,900 sq. ft. to a massive 8,260 sq. ft., with an average of 3,273 sq. ft.
- Lot Sizes: Property lots ranged between 0.5 acres and 16.46 acres, with an average lot size of 2.291 acres, catering to both manageable suburban living and spacious outdoor preferences.
Market Dynamics
- Days on Market (DOM): Properties averaged 91 days on the market, significantly dropping from 138 days in 2004, pointing to faster turnover and higher market responsiveness.
- ClsPr/LstPr Ratio: Properties closed at 96.46% of their listing price, indicating limited room for negotiation and a competitive buying environment.
- ClsPr/OLP Ratio: Closing prices averaged 94.51% of the original listing price, reflecting some pricing adjustments yet maintaining solid value.
- Price per Square Foot: The average price per sq. ft. stood at $106.15, reflecting moderate pricing on usable space.
Insights into the Most Expensive Lucas, TX Property Sold in 2005
The most expensive property sold in Lucas, TX during 2005 set a high standard for luxury and elegance in the market. Priced at $865,000, this stunning home combined expansive living spaces with premium features, although it spent 293 days on the market before closing. With a ClsPr/LstPr ratio of 87.37% and a ClsPr/OLP ratio of 73.62%, the property required significant adjustments from its original pricing.
Key highlights of this remarkable estate include:
- Price: $865,000
- Beds/Baths: 6 bedrooms, 6 bathrooms
- Square Footage: 5,540 sq. ft.
- Price per Sq. Ft.: $156.14
- Lot Size: 2 acres
- Days on Market (DOM): 293 days
- ClsPr/LstPr Ratio: 87.37%
- ClsPr/OLP Ratio: 73.62%
- Year Built: 2001
This home stood out as an exceptional property, blending spacious design with unique features, exemplifying the luxury spectrum of Lucas’s 2005 real estate market.
Economic context

Average Electricity Costs in Dallas-Fort Worth in 2005
Electricity prices rose to $0.11 per kilowatt-hour in 2005, a modest increase from 2004’s $0.10. The increase in energy costs could have slightly stretched household budgets, leaving less disposable income for home improvement projects or even down payments. This minor uptick serves as a reminder of how utility prices indirectly shape household affordability.
Average Price for Regular Gasoline in Texas in 2005
The average gas price jumped to $2.18 per gallon, compared to $1.73 in 2004. This significant rise likely affected commuting costs for potential homebuyers, especially those considering homes farther from urban centers. Higher gas prices may have shifted demand toward properties closer to metropolitan job hubs, where transportation costs were comparatively lower.
Average 30-Year Fixed Mortgage Rate in 2005
Mortgage rates edged slightly higher to 5.93% in 2005 from 5.88% in 2004. While this minor increase did not drastically alter affordability, it emphasized the need for homebuyers to act swiftly on favorable properties. To streamline the buying process, it’s crucial for prospective homeowners to secure pre-approval with a local mortgage loan originator, ensuring they can compete in a competitive market.
Curious about today’s mortgage rates and the home you can comfortably afford?
Submit a no-obligation mortgage application today and get pre-approved to determine your budget and take the first step toward homeownership with confidence.
Overview of Differences Between the 2004 and 2005 Real Estate Markets in Lucas, Texas
The comparison between Lucas’s real estate market in 2004 and 2005 shows notable shifts in activity, pricing, and market dynamics:
-
Total Homes Sold
- The total number of homes sold increased from 71 (2004) to 75 (2005), signifying higher overall demand in 2005.
-
Property Pricing
- The minimum price decreased significantly from $70,500 (2004) to $49,000 (2005), broadening affordability in the market.
- The maximum price slightly declined, from $900,000 in 2004 to $865,000 in 2005, indicating a modest shift in the luxury segment.
- However, the average sales price increased to $367,707 (2005) from $334,520 in 2004, reflecting an uptick in mid-range to high-end property sales.
- The median price rose from $315,000 (2004) to $335,500 (2005), suggesting higher price consistency.
-
Property Size and Features
- Homes in 2005 generally featured larger total square footage, with the maximum increasing to 8,260 sq. ft., compared to 5,045 sq. ft. in 2004.
- However, lot sizes in the luxury segment shrank, with the largest property in 2005 at 16.46 acres, down from 26.34 acres in 2004.
- The average home size increased slightly, from 3,222 sq. ft. (2004) to 3,273 sq. ft. (2005).
-
Market Dynamics
- Homes sold considerably faster in 2005, with the average DOM dropping to 91 days compared to 138 days in 2004.
- Negotiation efficiency improved, with the ClsPr/LstPr ratio rising from 95.53% in 2004 to 96.46% in 2005.
-
Distinct Outliers
- The price per square foot for the most expensive properties spiked to $177.39, compared to the 2004 maximum of $115,000, reflecting unique high-value properties in 2005.
- The oldest property built in 1900 adds historical diversity to the market, contrasting with newer builds.
-
Trends in New Construction and Homes with Pools
- New construction homes decreased from 18 (2004) to 12 (2005), suggesting a reduced influx of modern designs.
- Homes with pools rose to 22 in 2005, compared to 17 in 2004, meeting increased buyer preference for recreational amenities.
-
Economic Influences
- Mortgage rates rose slightly from 5.88% in 2004 to 5.93% in 2005, which may have impacted buying trends mildly.
Key Differences
The 2005 market emphasized faster sales and higher average price points, with less emphasis on large acreages or new construction homes. The increased number of homes with pools and shorter DOM highlighted a more competitive and responsive market dynamic.
Summary of Real Estate Market Analysis for Lucas, TX in 2005
The 2005 real estate market in Lucas, TX demonstrated a remarkable balance of diversity, efficiency, and opportunity. With a wide range of pricing options and property features, the market catered to buyers across all demographics—from entry-level purchasers to high-end luxury seekers.
Faster sales turnover, driven by reduced average Days on the Market and competitive price-to-list ratios, underscored the market’s dynamic and responsive nature. While luxury properties like the $865,000 estate highlighted exclusivity, the presence of affordable homes widened accessibility for a broader audience.
Despite a slight rise in mortgage rates, buyer interest remained robust, consolidating Lucas’s position as an attractive hub for real estate activity in 2005. This thriving market reflects a healthy balance between affordability and prestige, paving the way for continued growth and appeal.
The Importance of Statistical Data in Lucas, Texas Real Estate Market
Did you know that appraisers and Realtors rely on historical statistical data to determine a property’s current value?
Analyzing historical market data is essential for making informed decisions in today’s real estate market. Examining past trends provides valuable insights that facilitate accurate pricing, more strategic negotiations, and a comprehensive understanding of market dynamics.
Unlock Exceptional Service!
Assistance with all your real estate needs in the Dallas-Fort Worth area is just a click or call away. Reach out at 214-940-8149 or connect through the links below.
Greetings! I’m Oleg Sedletsky, and I’m excited to introduce myself as your go-to full-time licensed Texas REALTOR® and Mortgage Loan Originator.
I proudly represent JPAR® – Real Estate Brokerage as a REALTOR® and Utopia Mortgage LLC as a Mortgage Loan Originator! My designations and certifications reflect my dedication to helping you achieve your real estate goals in Lucas, TX and other locations in the vibrant Dallas-Fort Worth area!
My commitment to ongoing professional development means I’m always enhancing my skills to serve you better. You can count on me as your trusted expert throughout your real estate journey. Plus, I’m fluent in English, Ukrainian, and Russian and ready to assist you every step of the way!
It’s All About You and Your Real Estate Goals!
My mission is to serve you! With my knowledge and expertise, I’m here to help you achieve all your real estate goals!
I’m passionate about helping buyers and sellers navigate the exciting real estate landscape in Lucas, Texas! Whether you’re searching for your dream home, exploring land options, or looking for commercial properties, my Real Estate Services have you covered.
Contact me today for all your real estate needs in Lucas, Texas! Call/text 214-940-8149
A Comprehensive Analysis of Single-Family Residential Housing Market in Lucas, TX: 2003 to Present
2003-2010
Lucas, TX Real Estate Market Report 2003: Analysis and Trends
Lucas, TX Real Estate Market Report 2004: Analysis and Trends
Lucas, TX Real Estate Market Report 2005: Analysis and Trends
Lucas, TX Real Estate Market Report 2006: Analysis and Trends
Lucas, TX Real Estate Market Report 2007: Analysis and Trends
Lucas, TX Real Estate Market Report 2008: Analysis and Trends
Lucas, TX Real Estate Market Report 2009: Analysis and Trends
Lucas, TX Real Estate Market Report 2010: Analysis and Trends
2011-2020
Lucas, TX Real Estate Market Report 2011: Analysis and Trends
Lucas, TX Real Estate Market Report 2012: Analysis and Trends
Lucas, TX Real Estate Market Report 2013: Analysis and Trends
Lucas, TX Real Estate Market Report 2014: Analysis and Trends
Lucas, TX Real Estate Market Report 2015: Analysis and Trends
Lucas, TX Real Estate Market Report 2016: Analysis and Trends
Lucas, TX Real Estate Market Report 2017: Analysis and Trends
Lucas, TX Real Estate Market Report 2018: Analysis and Trends
Lucas, TX Real Estate Market Report 2019: Analysis and Trends
Lucas, TX Real Estate Market Report 2020: Analysis and Trends
This market analysis is intended solely for educational purposes. This market analysis is based on data sourced from NTREIS, Inc. This analysis is exclusively focused on single-family homes and does not account for other property types. The total number of real estate transactions within the specified period and location may vary. Data accuracy cannot be guaranteed due to potential input errors made by NTREIS users. This market analysis does not account for all new construction home sales. If you need detailed information about recorded property sales or other public records, please contact the appropriate city or county office.
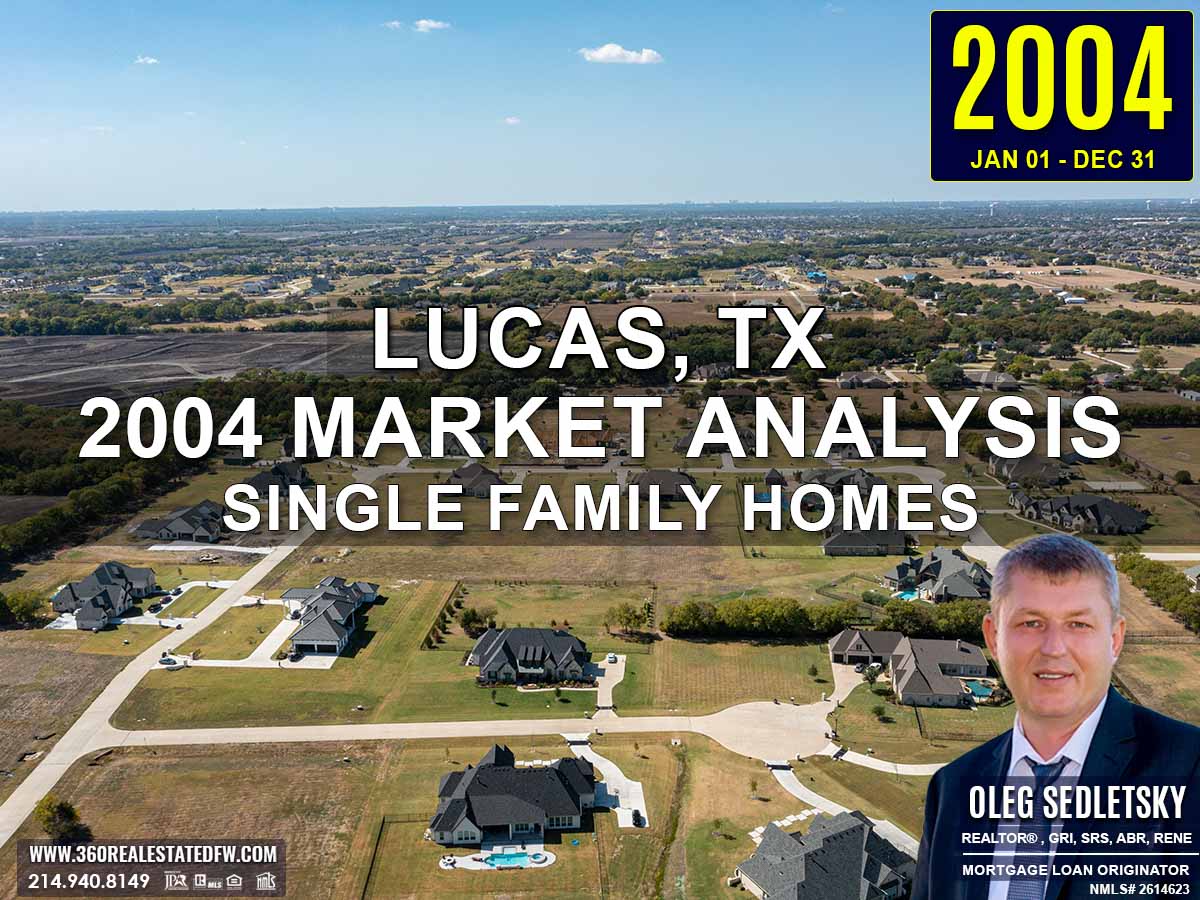
Lucas, TX Real Estate: A Comprehensive Analysis of the 2004 Single-Family Residential Housing Market
The 2004 real estate market in Lucas, TX showcased an intriguing mix of growth, variety, and changing dynamics. With 71 single-family homes sold over the year, the market witnessed a balance between affordability and luxury. Trends highlighted a shift in preferences toward expansive properties, alongside steady activity in all pricing tiers. Favorable mortgage rates of 5.88% further supported market engagement.
Key Takeaways and Trends from Lucas’s 2004 Real Estate Market
Pricing Range: The market accommodated a wide array of buyers—with entry-level prices at $70,500 and high-end sales reaching $900,000.
Market Efficiency: A slight decline in ClsPr/LstPr ratio and increased DOM signaled a cooling pace, although efficiency remained strong overall.
Unique Outliers: Properties with extensive acreage, like the 26.34-acre top sale, stood out for luxury-minded buyers.
Mortgage Rates Impact: Favorable rates at 5.88% for a 30-year fixed term likely sustained interest, balancing affordability during market fluctuations.
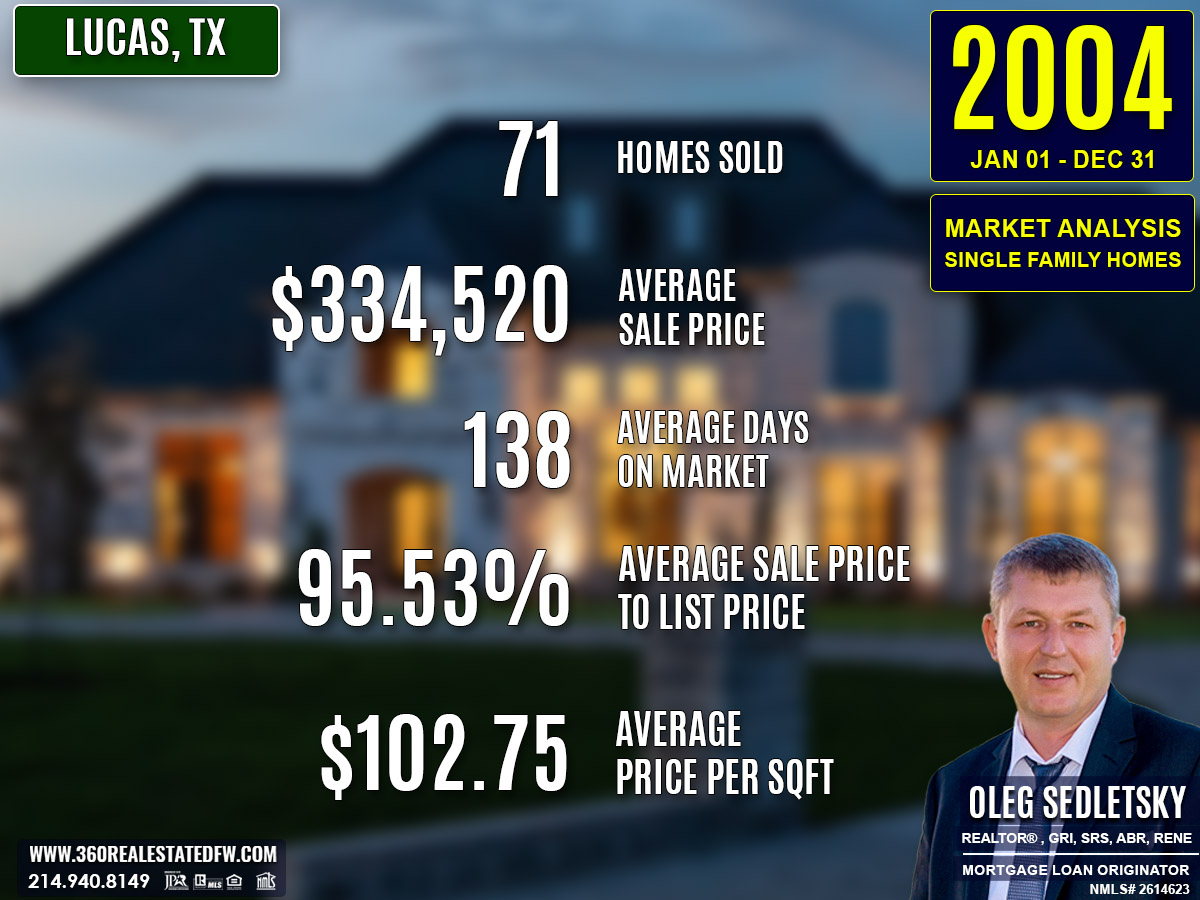
Total Homes Closed
A total of 71 homes closed in 2004, marking an increase from the previous year. Among these, 17 properties included pools, continuing the trend for amenity-rich homes. Additionally, 18 sales were for new construction homes, reflecting a modest decrease in modern build availability compared to 2003.
Property Pricing Insights
- Minimum Price: $70,500
- Maximum Price: $900,000
- Average Price: $334,520
- Median Price: $315,000
The broader pricing range indicated a market catering to diverse buyer segments. While the maximum price rose to $900,000, the average sales price trended slightly lower than the previous year.
Property Size and Features
Lucas homes in 2004 exhibited a range of configurations to suit buyers’ needs:
- Bedrooms: Ranged from 1 to 5, with an average of 4.
- Bathrooms: Included between 1 and 6, averaging 3.
- Square Footage: Home sizes varied from 99 sq. ft. to 5,045 sq. ft., averaging 3,222 sq. ft.
- Lot Sizes: Spanned a significant range from 0.5 acres to 26.34 acres, with an average of 2.539 acres.
These features highlighted options for both compact living and sprawling properties with extensive grounds.
Market Dynamics
- Days on Market (DOM): Homes spent an average of 138 days on the market, with a median of 85 days, reflecting slightly slower activity compared to 2003.
- ClsPr/LstPr Ratio: Closed at an average of 95.53% of their listing price, indicating strong market efficiency despite minimal negotiation gaps.
- ClsPr/OLP Ratio: Average closed prices were 94.13% of the original listing price, showing a need for occasional price adjustments to close sales.
- Price per Sq.Ft.: Averaged $102.75, maintaining affordability in comparison to the prior year.
Insights into the Most Expensive Lucas, TX Property Sold in 2004
The most expensive property sold in Lucas, TX during 2004 was an exceptional estate that highlighted luxury, space, and exclusivity. Priced at $900,000, this home drew attention with its expansive 26.34-acre lot and impressive features, despite spending 503 days on the market before closing. Although its ClsPr/LstPr ratio of 95.24% and ClsPr/OLP ratio of 90.14% indicated some negotiation, its appeal ultimately secured a buyer.
Key highlights of this property include:
- Price: $900,000
- Beds/Baths: 4 bedrooms, 4 bathrooms
- Square Footage: 5,045 sq. ft.
- Price per Square Foot: $178.39
- Lot Size: 26.34 acres
- Days on Market (DOM): 503 days
- ClsPr/LstPr Ratio: 95.24%
- ClsPr/OLP Ratio: 90.14%
- Year Built: 1986
Defined by its vast lot and luxury features, this property underscored the premium side of the 2004 Lucas, TX real estate market.
Economic context
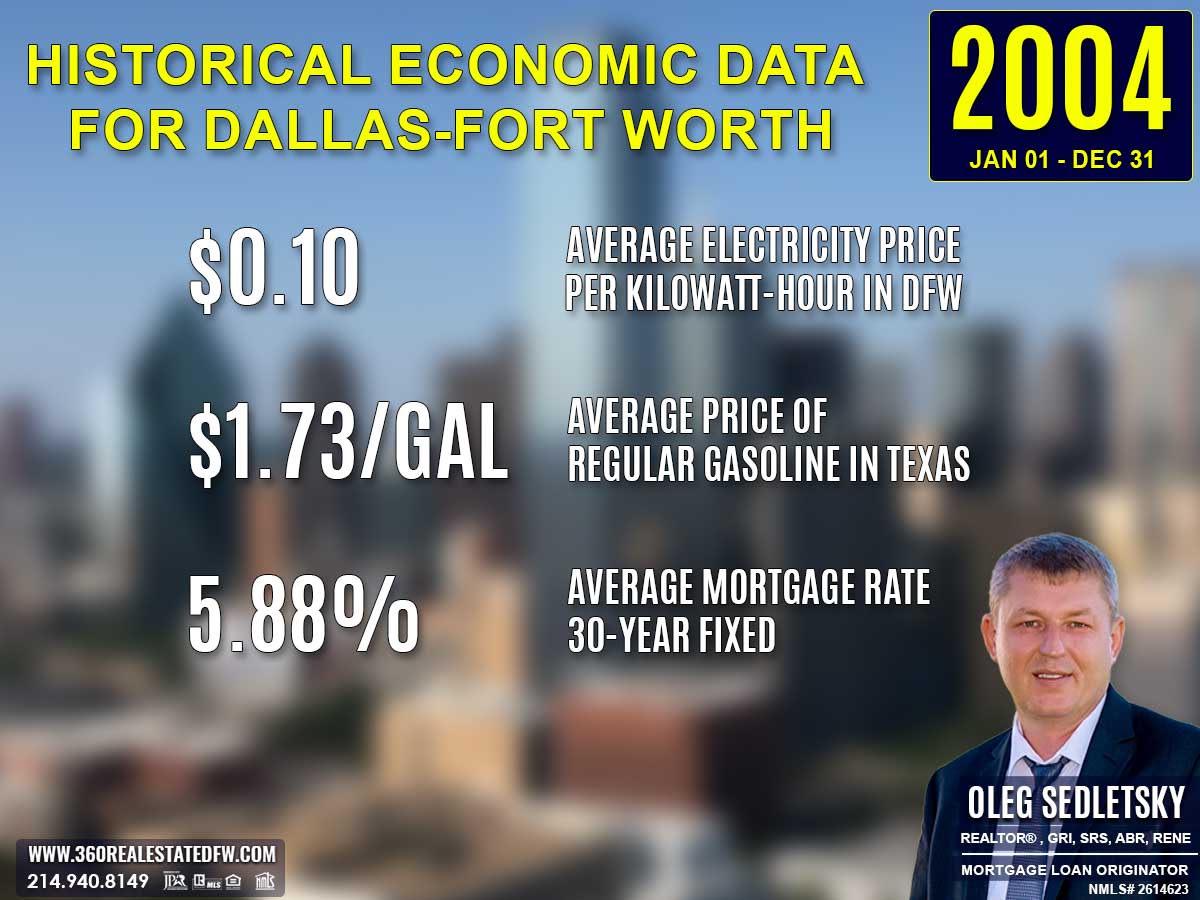
Average Electricity Costs in Dallas-Fort Worth in 2004
In 2004, the average electricity price rose slightly to $0.10 per kilowatt-hour, up from $0.09 the previous year. At this level, electricity costs remained relatively stable, offering homeowners and investors a sense of predictability. This steady pricing likely enabled households to budget energy expenses more consistently, allowing them to focus on prioritizing real estate investments with greater confidence.
Average Price for Regular Gasoline in Texas in 2004
Gasoline prices averaged $1.73 per gallon in 2004. This relatively low cost of fuel provided affordable transportation options for homebuyers. With manageable travel expenses, buyers might have been more willing to explore suburban or even rural areas where homes were more affordable. Accessible gas prices could play an indirect role in boosting regional housing markets.
Average 30-Year Fixed Mortgage Rate in 2004
The 30-year fixed mortgage rate settled at 5.88% in 2004. This moderate interest rate made it possible for many homebuyers to purchase homes without facing overly steep monthly payments. A balanced mortgage rate like this encouraged first-time homebuyers to enter the market. It’s vital for homebuyers to get pre-approved for a mortgage by connecting with a local mortgage loan originator to ensure they are aware of how much home they can truly afford.
Curious about today’s mortgage rates and the home you can comfortably afford?
Submit a no-obligation mortgage application today and get pre-approved to determine your budget and take the first step toward homeownership with confidence.
Overview of Differences Between the 2003 and 2004 Real Estate Markets in Lucas, Texas
The comparison between the 2003 and 2004 real estate markets in Lucas, TX highlights shifts in market dynamics and property trends:
-
Total Homes Sold
- The total number of homes sold increased from 65 (2003) to 71 (2004), reflecting slightly higher market activity.
-
Property Pricing
- The maximum price rose from $849,000 in 2003 to $900,000 in 2004, indicating an increased demand in the luxury segment.
- However, the average sales price dropped from $354,008 to $334,520, suggesting a shift to more affordable sales overall.
- The minimum price also fell substantially, from $126,700 (2003) to $70,500 (2004), offering more diversity in entry-level options.
-
Property Size and Features
- Homes in 2004 generally had smaller sizes, with the maximum square footage decreasing from 6,005 sq. ft. to 5,045 sq. ft.
- The average square footage also declined from 3,405 sq. ft. to 3,222 sq. ft.
- Lot sizes varied significantly, with the largest lot size in 2004 expanding to 26.34 acres, compared to 10 acres in 2003.
-
Market Dynamics
- Days on Market (DOM) increased on average by 17 days, moving from 121 days (2003) to 138 days (2004), indicating slightly slower sales turnover.
- ClsPr/LstPr (Close Price to Listing Price) Ratio: There was a slight dip in efficiency, with the average dropping from 96.15% (2003) to 95.53% (2004).
- ClsPr/OLP (Close Price to Original Listing Price) Ratio: Similarly, the average decreased from 94.39% (2003) to 94.13% (2004).
-
Outliers
- The highest price per square foot spiked dramatically, from $156.84 (2003) to $115,000.00 (2004), likely due to the mix of smaller properties or unique outliers influencing the metric.
- The most expensive property in 2004 spanned a massive 26.34 acres, compared to the 2 acres of the top property in 2003, signaling a shift in luxury buyer preferences.
-
Trends in Homes with Pools and New Construction
- Homes with pools slightly decreased, from 18 homes (2003) to 17 homes (2004).
- New construction properties saw a drop from 26 homes (2003) to 18 homes (2004), reflecting reduced supply of newer builds in the market.
-
Mortgage Rates
- The average mortgage rates saw a marginal decrease from 5.89% in 2003 to 5.88% in 2004, remaining favorable for buyers but without significant impact on market trends.
Notable Trends
The 2004 market emphasizes affordability with a broader pricing range and a higher volume of smaller homes. The presence of larger lots and continued activity in high-end property sales retains appeal for luxury buyers, but the slight increases in DOM and reduced new constructions signal slower market turnover compared to the previous year.
Summary of Real Estate Market Analysis for Lucas, TX in 2004
The 2004 real estate market in Lucas, TX showcased a harmonious balance of diversity and opportunity. With a broader price range and a mix of compact, affordable homes and expansive luxury estates, it successfully catered to the needs of a wide spectrum of buyers.
From entry-level properties to high-end homes like the $900,000 estate with its vast acreage, the market emphasized accessibility and exclusivity. Despite slightly longer days on the market, buyer interest remained strong, supported by favorable mortgage rates. The market’s performance demonstrated resilience and growth, reinforcing Lucas’s position as a vibrant and attractive location for homebuyers and investors alike.
The Importance of Statistical Data in Lucas, Texas Real Estate Market
Did you know that appraisers and Realtors rely on historical statistical data to determine a property’s current value?
Analyzing historical market data is essential for making informed decisions in today’s real estate market. Examining past trends provides valuable insights that facilitate accurate pricing, more strategic negotiations, and a comprehensive understanding of market dynamics.
Unlock Exceptional Service!
Assistance with all your real estate needs in the Dallas-Fort Worth area is just a click or call away. Reach out at 214-940-8149 or connect through the links below.
Greetings! I’m Oleg Sedletsky, and I’m excited to introduce myself as your go-to full-time licensed Texas REALTOR® and Mortgage Loan Originator.
I proudly represent JPAR® – Real Estate Brokerage as a REALTOR® and Utopia Mortgage LLC as a Mortgage Loan Originator! My designations and certifications reflect my dedication to helping you achieve your real estate goals in Lucas, TX and other locations in the vibrant Dallas-Fort Worth area!
My commitment to ongoing professional development means I’m always enhancing my skills to serve you better. You can count on me as your trusted expert throughout your real estate journey. Plus, I’m fluent in English, Ukrainian, and Russian and ready to assist you every step of the way!
It’s All About You and Your Real Estate Goals!
My mission is to serve you! With my knowledge and expertise, I’m here to help you achieve all your real estate goals!
I’m passionate about helping buyers and sellers navigate the exciting real estate landscape in Lucas, Texas! Whether you’re searching for your dream home, exploring land options, or looking for commercial properties, my Real Estate Services have you covered.
Contact me today for all your real estate needs in Lucas, Texas! Call/text 214-940-8149
A Comprehensive Analysis of Single-Family Residential Housing Market in Lucas, TX: 2003 to Present
2003-2010
Lucas, TX Real Estate Market Report 2003: Analysis and Trends
Lucas, TX Real Estate Market Report 2004: Analysis and Trends
Lucas, TX Real Estate Market Report 2005: Analysis and Trends
Lucas, TX Real Estate Market Report 2006: Analysis and Trends
Lucas, TX Real Estate Market Report 2007: Analysis and Trends
Lucas, TX Real Estate Market Report 2008: Analysis and Trends
Lucas, TX Real Estate Market Report 2009: Analysis and Trends
Lucas, TX Real Estate Market Report 2010: Analysis and Trends
2011-2020
Lucas, TX Real Estate Market Report 2011: Analysis and Trends
Lucas, TX Real Estate Market Report 2012: Analysis and Trends
Lucas, TX Real Estate Market Report 2013: Analysis and Trends
Lucas, TX Real Estate Market Report 2014: Analysis and Trends
Lucas, TX Real Estate Market Report 2015: Analysis and Trends
Lucas, TX Real Estate Market Report 2016: Analysis and Trends
Lucas, TX Real Estate Market Report 2017: Analysis and Trends
Lucas, TX Real Estate Market Report 2018: Analysis and Trends
Lucas, TX Real Estate Market Report 2019: Analysis and Trends
Lucas, TX Real Estate Market Report 2020: Analysis and Trends
This market analysis is intended solely for educational purposes. This market analysis is based on data sourced from NTREIS, Inc. This analysis is exclusively focused on single-family homes and does not account for other property types. The total number of real estate transactions within the specified period and location may vary. Data accuracy cannot be guaranteed due to potential input errors made by NTREIS users. This market analysis does not account for all new construction home sales. If you need detailed information about recorded property sales or other public records, please contact the appropriate city or county office.
Dallas-Fort Worth Housing Market - Collin County Housing Market: Prices, Trends | January 2025
Housing Report for Dallas-Fort Worth-Arlington Metropolitan Statistical Area – January 2025
Single-Family Homes SUMMARY
Sales volume for single-family homes increased 1.1% YoY from 4,924 to 4,978 transactions.
Dollar volume rose from $2.34 billion to $2.41 billion.
The average sales price rose 2.01% YoY from $475,515 to $485,086,
The average price per square foot declined from $202.34 to $201.89.
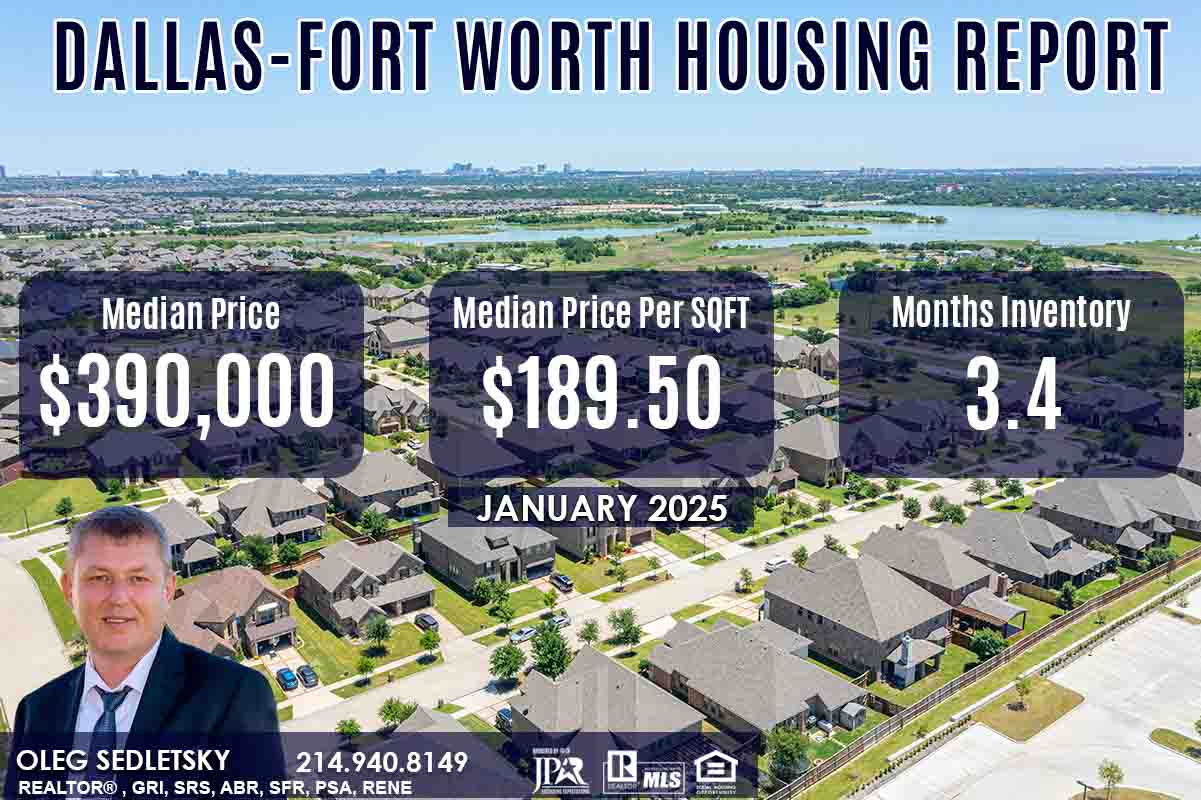
Median price rose 1.3% YoY from $385,000 to $390,000.
Median price per square foot declined from $190.45 to $189.50.
Months inventory for single-family homes rose from 2.5 to 3.4 months supply.
Days to sell rose from 92 to 101.
—
(Days to Sell = Days on Market + Days to Close)
(YoY – Year-over-Year is a calculation commonly used in economics or financial data to show how information from one time period compares to the year prior. )
Dallas-Fort Worth Housing Report January 2025 (single family homes residential)
January 2025 | YoY %
Home Sales: 4,978 | 1.10%
Dollar Volume: $2,414,757,442 | 3.13%
Median Close Price: $390,000 | 1.30%
New Listings: 10,541 | 22.50%
Active Listings: 24,382 | 38.80%
Months Inventory: 3.4 | 35.79%
Days to Sell: 101 | 9.78%
Average Price PSF: $201.89 | -0.22%
Median Price PSF: $189.50 | -0.50%
Median Square Feet: 2,102 | 0.82%
Close to Original List Price: 94.06% | -0.69%
COLLIN COUNTY HOUSING REPORT – January 2025
January 2025 | YoY %
New Listings: 2,014 | + 24.6%
Average Sales Price: $535,348 | + 0.8%
Median Sales Price: $464,000 | – 2.8%
Days on Market Until Sale: 66 | + 20.0%
Inventory of Homes for Sale: 4,364 | + 60.6%
Months Supply of Inventory: 3.3 | + 50.0%
Close to Original List Price: 94.0% | – 1.3%
Note! Sales Prices do not include prices from any previous listing contracts or seller concessions.
Relocating to Dallas-Fort Worth?
Consider Willow Ridge community in Prosper, Texas
Welcome to the vibrant Willow Ridge community, future homeowners! You’re about to explore a unique blend of luxury, convenience, and a family-friendly atmosphere. Nestled in the heart of Town of Prosper, TX, the Willow Ridge community offers a lifestyle that’s both dynamic and serene. I’m Oleg Sedletsky, your go-to Realtor and Mortgage Loan Originator in Prosper, Texas, and I’m excited to introduce you to the remarkable features and benefits here at Willow Ridge. Let’s dive into all that this amazing community has to offer!
Prosper, TX is located in Collin County Texas and is part of Dallas-Fort Worth metropolitan area.


About the data used in this report
Data used in Dallas-Fort Worth- Arlington report come from Texas Realtor® Data Relevance Project, a partnership between the Texas Association of Realtors® and local Realtor® associations throughout the state. The analysis is provided through a research agreement with the Real Estate Center at Texas A&M University
Data used in Collin County report come from North Texas Real Estate Information Services, Inc.
You may also be interested in:
Latest from Dallas Real Estate Blog
– Texas Homebuyers Tips, Tricks and Lifehacks
– New Construction Homes in Dallas TX
– Texas Home Sellers Tips, Tricks and Lifehacks
– Mortgages for Homebuyers and Investors in Dallas-Fort Worth
Dallas-Fort Worth Relocation Guide
Explore an important information for Home Sellers in the Dallas-Fort Worth area
Explore an important information for Home Buyers in the Dallas-Fort Worth area
2025
Dallas-Fort Worth Housing Market – Collin County Housing Market: Prices and Trends | January 2025
Dallas-Fort Worth Housing Market – Collin County Housing Market: Prices and Trends | February 2025
Dallas-Fort Worth Housing Market – Collin County Housing Market: Prices and Trends | March 2025
Dallas-Fort Worth Housing Market – Collin County Housing Market: Prices and Trends | April 2025
Dallas-Fort Worth Housing Market – Collin County Housing Market: Prices and Trends | May 2025
Dallas-Fort Worth Housing Market – Collin County Housing Market: Prices and Trends | June 2025
Dallas-Fort Worth Housing Market – Collin County Housing Market: Prices and Trends | July 2025
Dallas-Fort Worth Housing Market – Collin County Housing Market: Prices and Trends | August 2025
Dallas-Fort Worth Housing Market – Collin County Housing Market: Prices and Trends | September 2025
Dallas-Fort Worth Housing Market – Collin County Housing Market: Prices and Trends | October 2025
Dallas-Fort Worth Housing Market – Collin County Housing Market: Prices and Trends | November 2025
Dallas-Fort Worth Housing Market – Collin County Housing Market: Prices and Trends | December 2025
2024
Dallas-Fort Worth Housing Market: Prices and Trends | December 2024
Dallas-Fort Worth Housing Market: Prices and Trends | November 2024
Dallas-Fort Worth Housing Market: Prices and Trends | October 2024
Dallas-Fort Worth Market: Prices and Trends | September 2024
Dallas-Fort Worth Housing Market: Prices and Trends | August 2024
Dallas-Fort Worth Housing Market: Prices and Trends | July 2024
Dallas-Fort Worth Housing Market: Prices and Trends | June 2024
Dallas-Fort Worth Housing Market: Prices and Trends | May 2024
Dallas-Fort Worth Housing Market: Prices and Trends | April 2024
Dallas-Fort Worth Housing Market: Prices and Trends | March 2024
Dallas-Fort Worth Housing Market: Prices and Trends | February 2024
Dallas-Fort Worth Housing Market: Prices and Trends | January 2024
2023
Dallas-Fort Worth Housing Market: Prices and Trends | December 2023
Dallas-Fort Worth Housing Market: Prices and Trends | November 2023
Dallas-Fort Worth Housing Market: Prices and Trends | October 2023
Dallas-Fort Worth Housing Market: Prices and Trends | September 2023
Dallas-Fort Worth Housing Market: Prices and Trends | August 2023
Dallas-Fort Worth Housing Market: Prices and Trends | July 2023
Dallas-Fort Worth Housing Market: Prices and Trends | June 2023
Dallas-Fort Worth Housing Market: Prices and Trends | May 2023
Dallas-Fort Worth Housing Market: Prices and Trends | April 2023
Dallas-Fort Worth Housing Market: Prices and Trends | March 2023
Dallas-Fort Worth Housing Market: Prices and Trends | February 2023
Dallas-Fort Worth Housing Market: Prices and Trends | January 2023
2022
Dallas-Fort Worth Housing Market: Prices and Trends | December 2022
Dallas-Fort Worth Housing Market: Prices and Trends | November 2022
Dallas-Fort Worth Housing Market: Prices and Trends | October 2022
Dallas-Fort Worth Housing Market: Prices and Trends | September 2022
Dallas-Fort Worth Housing Market: Prices and Trends | August 2022
Dallas-Fort Worth Housing Market: Prices and Trends | July 2022
Dallas-Fort Worth Housing Market: Prices and Trends | June 2022
Dallas-Fort Worth Housing Market: Prices and Trends | May 2022
Dallas-Fort Worth Housing Market: Prices and Trends | April 2022
Dallas-Fort Worth Housing Market: Prices and Trends | March 2022
Dallas-Fort Worth Housing Market: Prices and Trends | February 2022
Dallas-Fort Worth Housing Market: Prices and Trends | January 2022
Lucas, TX Real Estate: A Comprehensive Analysis of the 2003 Single-Family Residential Housing Market
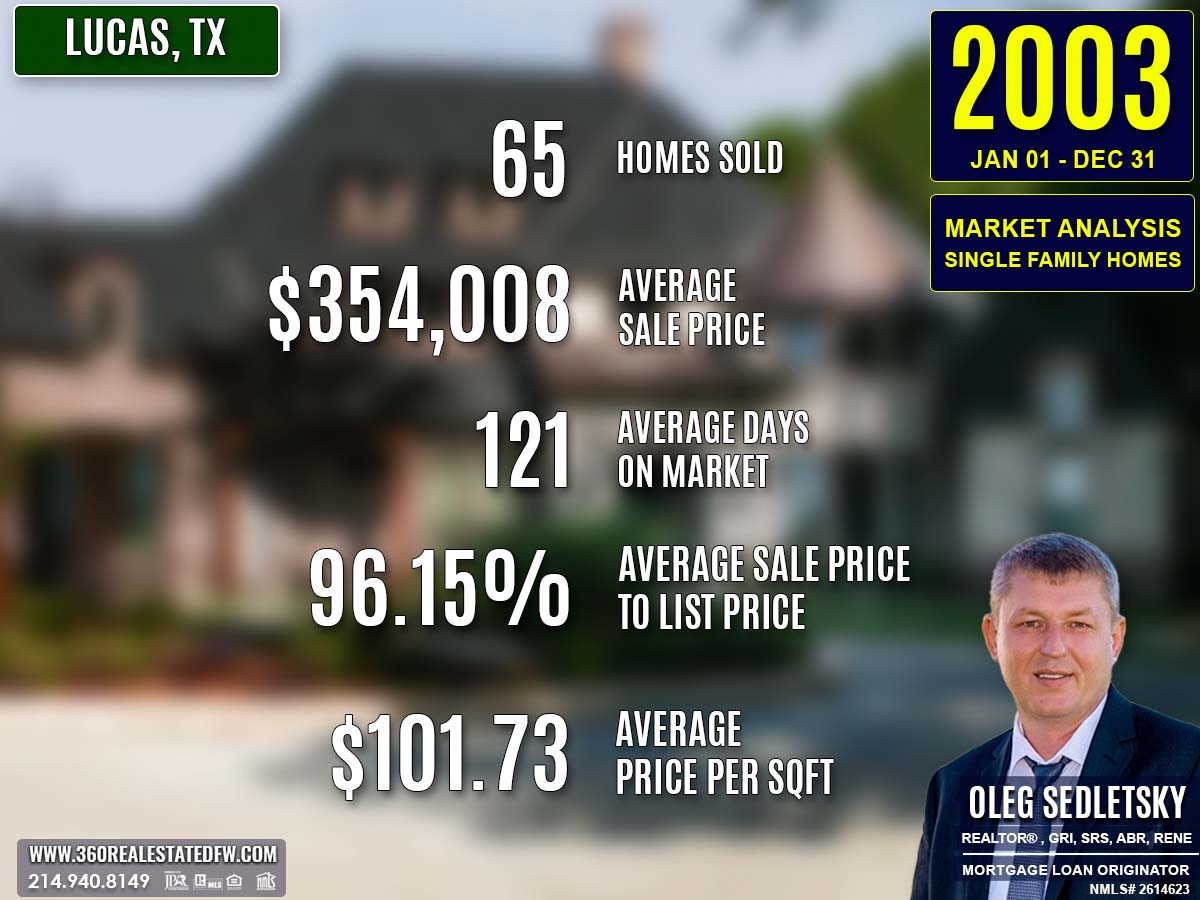
The real estate market in Lucas, Texas for the year 2003 showcased a dynamic mix of affordability, luxury, and lifestyle options. With 65 single-family homes sold, the market offered diversity in property features and pricing, catering to a range of buyers from first-time homeowners to those seeking upscale estates.
Key Takeaways and Trends from Lucas’s 2003 Real Estate Market
Pricing Range: The market offered a wide price range, with homes selling between $126,700 and $849,000. This indicates the availability of options for both entry-level buyers and those seeking luxury estates.
Market Efficiency: Homes achieved an average ClsPr/LstPr ratio of 96.15%, with some properties exceeding the listing price. Average Days on Market (DOM) was 121 days, signaling moderate selling speed and a fairly active market.
Unique Outliers: Luxury homes, such as the most expensive property at $849,000, brought diversity and appeal to high-end buyers. This property exemplified high quality with 5,928 sq. ft., 5 beds, 6 baths, a DOM of 131 days, and a 100% listing-to-closing price ratio.
Impact of Mortgage Rates: The average 30-year fixed mortgage rate of 5.89% likely balanced affordability against long-term financing. This steady rate may have contributed to consistent purchasing trends and a stable real estate market.
Total Homes Closed
A total of 65 homes were closed in 2003. This included 18 homes with pools, illustrating a strong interest in premium lifestyle amenities. Additionally, 26 of these sales were new construction homes, signaling a healthy demand for contemporary designs and modern features.
Property Pricing Insights
- Minimum Price: $126,700
- Maximum Price: $849,000
- Average Price: $354,008
- Median Price: $345,000
The pricing data reveals a broad spectrum, accommodating both budget-conscious buyers and those looking for high-end properties.
Property Size and Features
The homes sold showcased a variety of sizes and configurations to suit diverse needs:
- Bedrooms: Ranged from 3 to 6, with an average of 4.
- Bathrooms: Spanned 2 to 6, averaging 4.
- Square Footage: Properties ranged from 981 sq. ft. to 6,005 sq. ft., averaging 3,405 sq. ft.
- Lot Sizes: Sizes varied widely, between 0.5 acres and 10 acres, with an average of 2.189 acres.
These numbers highlight the availability of compact homes for smaller families and sprawling estates for buyers seeking space.
Market Dynamics
- Days on Market (DOM): The average property remained on the market for 121 days, with a median of 81 days, reflecting moderate turnaround times.
- ClsPr/LstPr Ratio: On average, homes sold for 96.15% of their listing price, with a median of 97.32%, indicating fair market efficiency.
- ClsPr/OLP Ratio: The average closed price stood at 94.39% of the original listing price, suggesting a marginal need for price adjustments.
- Price per Sq.Ft.: Averaged at $101.73, with a range from $52.18 to $156.84.
Insights into the Most Expensive Lucas, TX Property Sold in 2003
The most expensive property sold in 2003 was a standout example of luxury real estate:
- Price: $849,000
- Beds/Baths: 5 Bedrooms, 6 Baths (5 full, 1 half)
- Square Footage: 5,928 sq. ft.
- Lot Size: 2 Acres
- DOM: 131 Days
- Price per Sq.Ft.: $143.22
- ClsPr/LstPr Ratio: 100%
- ClsPr/OLP Ratio: 94.44%
- Year Built: 2001
This property captivated buyers with its grand design, contemporary build, and strong market positioning. Holding steady at 100% of its listing price, it sparked buyer confidence and emphasized the demand for high-quality homes.
Economic context
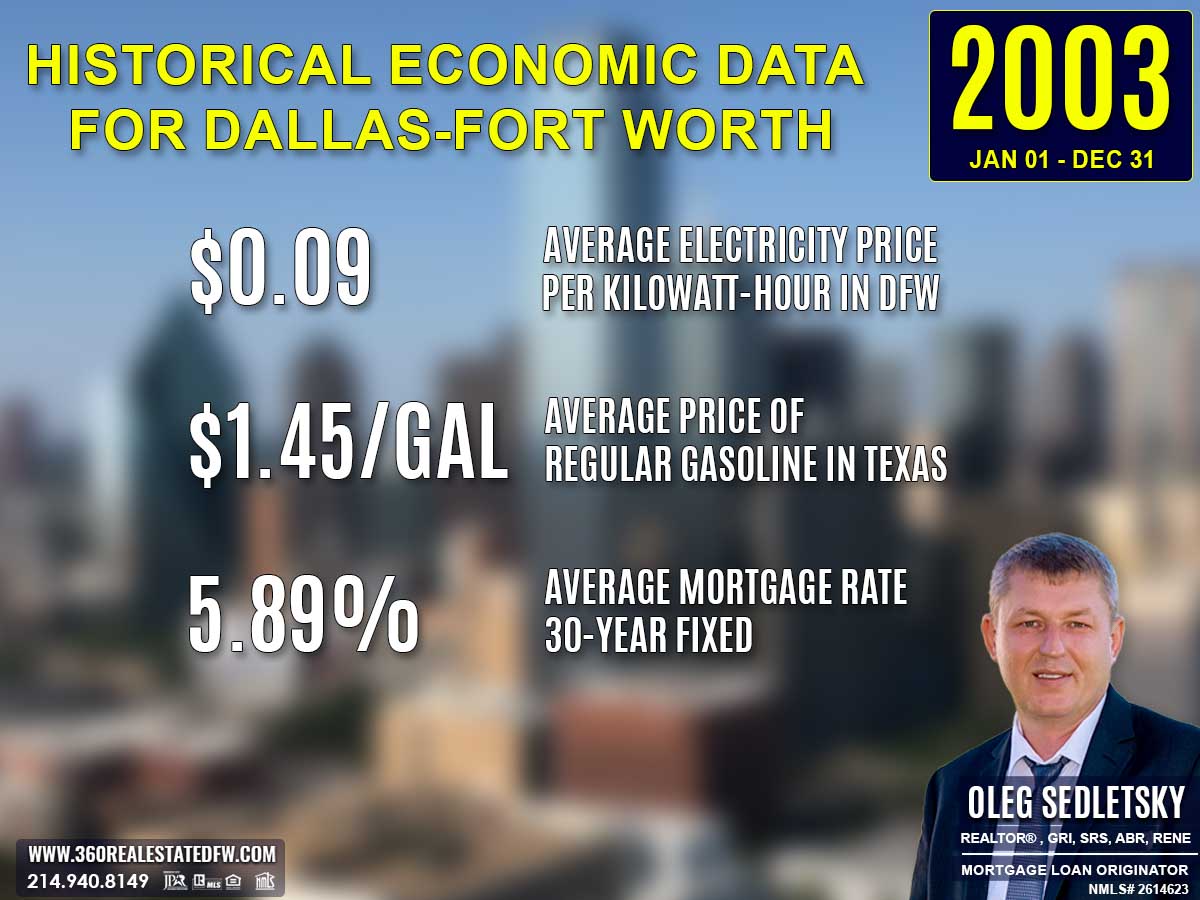
Average Electricity Costs in Dallas-Fort Worth in 2003
Electricity costs averaged just $0.09 per kilowatt hour this year, offering significant savings for both homeowners and renters. These low energy rates made it easier to afford the upkeep of larger properties, including high square footage homes and luxury residences.
Average Price for Regular Gasoline in Texas in 2003
With gasoline prices averaging $1.45 per gallon, transportation costs remained relatively affordable, offering a financial advantage to suburban and outlying city areas. Lower fuel prices made commuting more feasible for potential homebuyers, encouraging them to explore properties farther from the city center. This likely fostered a diverse range of housing options across neighborhoods, enhancing the market’s appeal to a broader spectrum of buyers.
Average 30-Year Fixed Mortgage Rate in 2003
The average 30-year fixed mortgage rate of 5.89% offered homebuyers a balanced borrowing environment. Although not at historic lows, this rate provided a practical and accessible option for financing home purchases. It supported market affordability, enabling families to manage monthly payments on a range of properties, from starter homes to high-end residences.
Curious about today’s mortgage rates and the home you can comfortably afford?
Submit a no-obligation mortgage application today and get pre-approved to determine your budget and take the first step toward homeownership with confidence.
Summary of Real Estate Market Analysis for Lucas, TX in 2003
The 2003 real estate market in Lucas, TX showcased an impressive balance of diversity, efficiency, and opportunity. With a mix of practical family homes, luxurious estates, and modern new builds, the market successfully catered to a wide spectrum of buyer preferences and budgets.
The steady volume of closed transactions, competitive pricing dynamics, and reasonable days on market highlighted a robust and functional marketplace. Notably, the market combined affordability with high-end options, underpinned by stable mortgage rates that supported steady buyer confidence.
Overall, Lucas’s real estate environment in 2003 was not only balanced but also vibrant, pointing to both its desirability as a residential area and its growth potential.
The Importance of Statistical Data in Lucas, Texas Real Estate Market
Did you know that appraisers and Realtors rely on historical statistical data to determine a property’s current value?
Analyzing historical market data is essential for making informed decisions in today’s real estate market. Examining past trends provides valuable insights that facilitate accurate pricing, more strategic negotiations, and a comprehensive understanding of market dynamics.
Unlock Exceptional Service!
Assistance with all your real estate needs in the Dallas-Fort Worth area is just a click or call away. Reach out at 214-940-8149 or connect through the links below.
Greetings! I’m Oleg Sedletsky, and I’m excited to introduce myself as your go-to full-time licensed Texas REALTOR® and Mortgage Loan Originator.
I proudly represent JPAR® – Real Estate Brokerage as a REALTOR® and Utopia Mortgage LLC as a Mortgage Loan Originator! My designations and certifications reflect my dedication to helping you achieve your real estate goals in Lucas, TX and other locations in the vibrant Dallas-Fort Worth area!
My commitment to ongoing professional development means I’m always enhancing my skills to serve you better. You can count on me as your trusted expert throughout your real estate journey. Plus, I’m fluent in English, Ukrainian, and Russian and ready to assist you every step of the way!
It’s All About You and Your Real Estate Goals!
My mission is to serve you! With my knowledge and expertise, I’m here to help you achieve all your real estate goals!
I’m passionate about helping buyers and sellers navigate the exciting real estate landscape in Lucas, Texas! Whether you’re searching for your dream home, exploring land options, or looking for commercial properties, my Real Estate Services have you covered.
Contact me today for all your real estate needs in Lucas, Texas! Call/text 214-940-8149
A Comprehensive Analysis of Single-Family Residential Housing Market in Lucas, TX: 2003 to Present
2003-2010
Lucas, TX Real Estate Market Report 2003: Analysis and Trends
Lucas, TX Real Estate Market Report 2004: Analysis and Trends
Lucas, TX Real Estate Market Report 2005: Analysis and Trends
Lucas, TX Real Estate Market Report 2006: Analysis and Trends
Lucas, TX Real Estate Market Report 2007: Analysis and Trends
Lucas, TX Real Estate Market Report 2008: Analysis and Trends
Lucas, TX Real Estate Market Report 2009: Analysis and Trends
Lucas, TX Real Estate Market Report 2010: Analysis and Trends
2011-2020
Lucas, TX Real Estate Market Report 2011: Analysis and Trends
Lucas, TX Real Estate Market Report 2012: Analysis and Trends
Lucas, TX Real Estate Market Report 2013: Analysis and Trends
Lucas, TX Real Estate Market Report 2014: Analysis and Trends
Lucas, TX Real Estate Market Report 2015: Analysis and Trends
Lucas, TX Real Estate Market Report 2016: Analysis and Trends
Lucas, TX Real Estate Market Report 2017: Analysis and Trends
Lucas, TX Real Estate Market Report 2018: Analysis and Trends
Lucas, TX Real Estate Market Report 2019: Analysis and Trends
Lucas, TX Real Estate Market Report 2020: Analysis and Trends
This market analysis is intended solely for educational purposes. This market analysis is based on data sourced from NTREIS, Inc. This analysis is exclusively focused on single-family homes and does not account for other property types. The total number of real estate transactions within the specified period and location may vary. Data accuracy cannot be guaranteed due to potential input errors made by NTREIS users. This market analysis does not account for all new construction home sales. If you need detailed information about recorded property sales or other public records, please contact the appropriate city or county office.
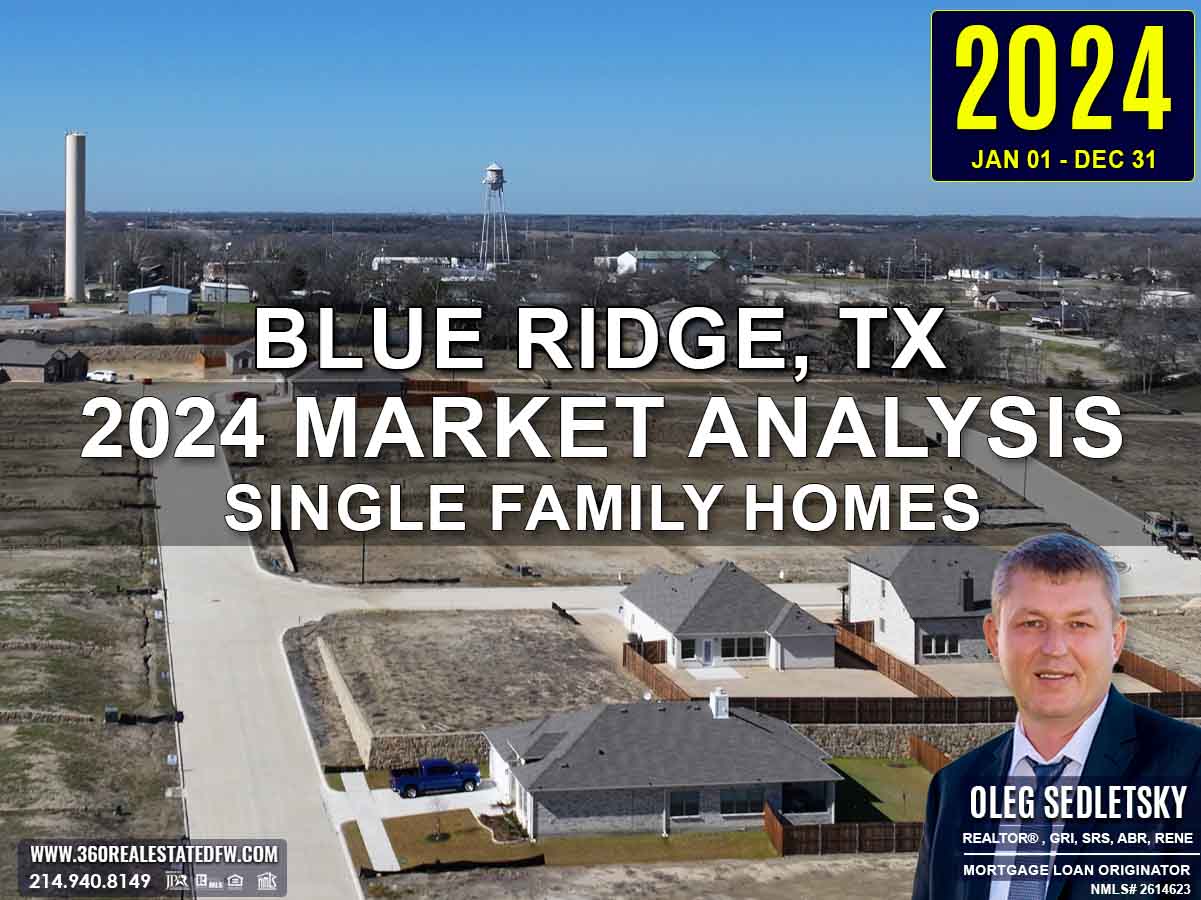
Blue Ridge, TX Real Estate: 2024 Analysis of the Single-Family Residential Housing Market
The 2024 real estate market in Blue Ridge, Texas presented a year of adjustment and growth. While still navigating the echoes of economic pressures, including elevated utility costs and slightly eased mortgage rates, the market exhibited notable recovery, particularly in pricing and property features. With 43 single-family homes closed, the market showed moderation in activity compared to previous years but signaled expanding demand for larger, updated homes.
Key Takeaways and Trends from Blue Ridge’s 2024 Real Estate Market
Pricing Range: The market showed widespread recovery, with substantial increases in both maximum and median prices, supported by luxury transactions and broader affordability in new entry-level thresholds.
Market Efficiency: Extended days on the market underscored slower homebuyer decisions and lengthier negotiation cycles, while improved price ratios reflected more strategic pricing by sellers.
Unique Outliers: Unlike 2023’s skewed lot size averages, 2024 normalized, favoring reasonable acreage for residential use. However, certain high-value properties remained notable outliers in their scale and pricing.
Total Homes Closed
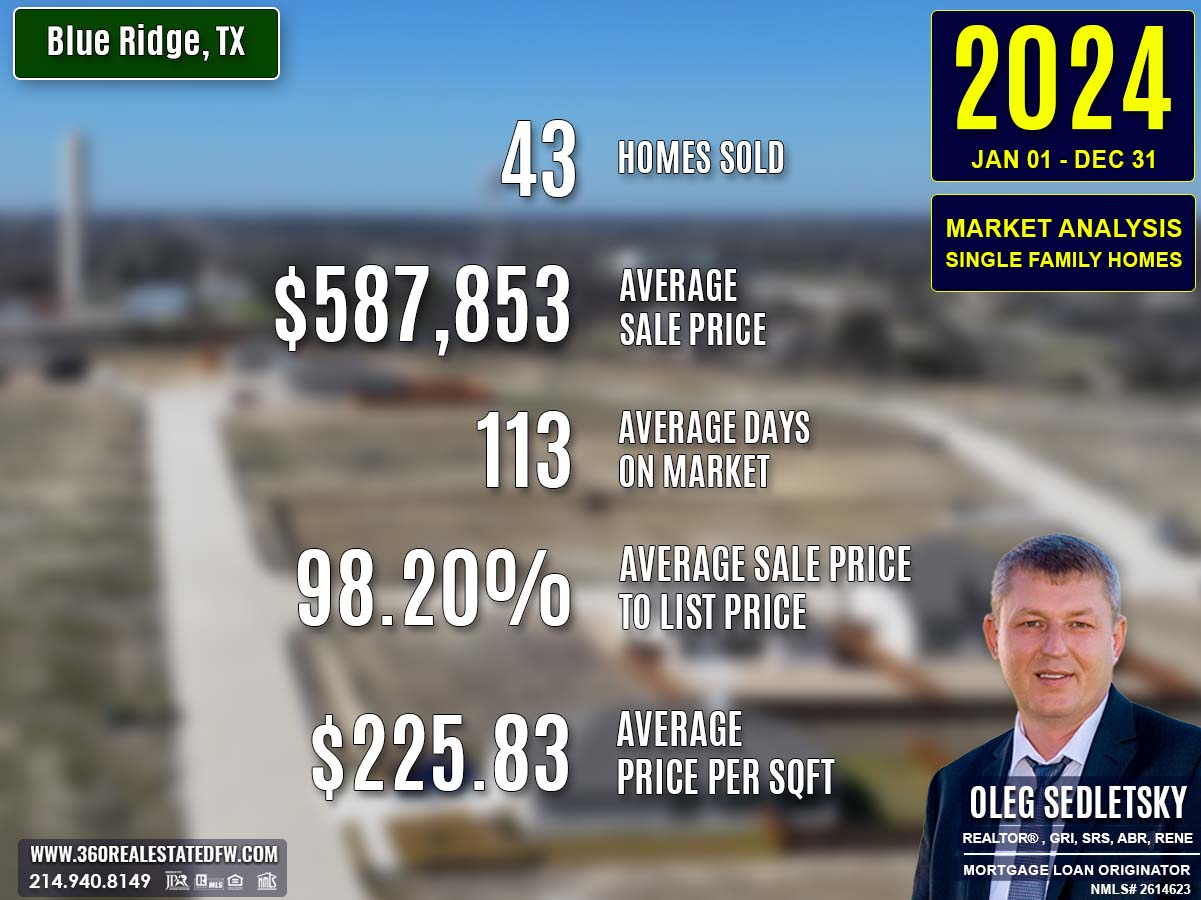
43 homes were sold in 2024, down from the 49 sales recorded in 2023. This slight reduction reflects a cooling in market activity influenced by extended sales cycles and evolving buyer priorities.
Property Pricing Insights
The 2024 market displayed significant gains in pricing metrics, particularly in the luxury segment:
- Minimum Price: Increased to $195,000, solidifying a higher entry point for buyers.
- Maximum Price: Surged to $1,900,000, indicating a revival of luxury transactions.
- Average Price: Climbed to $587,853, showcasing renewed mid-market strength.
- Median Price: Rose to $569,900, signaling broad recovery across all price ranges.
Property Size and Features
The market reflected buyer demand for more spacious homes and family-friendly layouts:
- Bedrooms: Averaged 4 bedrooms, up from 3 in 2023, meeting the needs of larger households.
- Bathrooms: Held steady at 3 bathrooms, maintaining functional designs.
Square Footage
- Minimum Size: Increased to 1,095 sq. ft., offering slightly roomier entry-level homes.
- Maximum Size: Increased to 5,344 sq. ft., catering to high-end buyers seeking luxury.
- Average Size: Rose to 2,600 sq. ft., demonstrating buyer desire for larger homes.
- Median Size: Climbed to 2,580 sq. ft., reflecting a growing trend toward more space in mid-market properties.
Lot Size
- Average Lot Size: Settled at 6.053 acres, substantially reduced from the anomalous lot averages in 2023 but demonstrating a preference for generous outdoor spaces.
Market Dynamics
Transaction efficiency slowed significantly in 2024, as reflected in key metrics:
-
Days on Market (DOM):
- Average DOM: Increased to 113 days, compared to 87 days in 2023, highlighting a lengthened purchasing cycle.
- Maximum DOM: Reached 676 days, emphasizing challenges in selling select properties.
-
Close-to-Price Ratios:
- ClsPr/LstPr (Close Price to Listing Price): Improved marginally to 98.20%, showcasing stronger seller alignment with market expectations.
- ClsPr/OLP (Close Price to Original Listing Price): Increased to 95.16%, reinforcing improved pricing accuracy.
-
Price Per Square Foot (Pr$/SqFt): Rose slightly to $225.83 from $219.65, reflecting stable appreciation alongside increased home sizes.
Insights into the Most Expensive Blue Ridge, TX Property Sold in 2024
The highest-priced property sold in 2024 highlighted the resilience of Blue Ridge’s luxury market:
- Price: $1,900,000
- Bedrooms: 4
- Bathrooms: 4 (all full baths)
- Square Footage: 5,344 sq. ft.
- Price Per Square Foot: $355.54
- Lot Size: 30.109 acres
- Days on Market (DOM): 182 days
- ClsPr/LstPr Ratio: 95.00%
- ClsPr/OLP Ratio: 86.36%
- Year Built: 1996
This home combined expansive living space with significant acreage, appealing to high-end buyers ready to invest.

Economic context
Average Electricity Costs in Dallas-Fort Worth in 2024
The average cost of electricity rose to $0.19/kWh, adding modest pressure on household budgets and energy expenses.
Texas Average Gas Prices in 2024
Gasoline costs decreased to $2.86 per gallon, offering a slight reprieve in transportation-related expenses for residents.
Average 30-Year Fixed Mortgage Rate in 2024
The average 30-year fixed mortgage rate in 2024 stood at 6.90%, a slight decline from the previous year’s 7.00%. This small reduction offered some relief to potential buyers, lowering monthly payments and enabling better affordability for mid-market and entry-level buyers. Despite this, affordability challenges remained a key factor in decision-making, as buyers continued to balance rising home prices with financing limitations.
Curious about today’s mortgage rates and the home you can comfortably afford?
Submit a no-obligation mortgage application today and get pre-approved to determine your budget and take the first step toward homeownership with confidence.
Summary of Differences Between 2023 and 2024 Real Estate Data for Blue Ridge, TX
The comparison of 2024 and 2023 real estate data for Blue Ridge, Texas reveals significant market shifts, particularly in pricing, property features, and market dynamics, while echoing broader economic influences on buyer and seller behavior.
Property Pricing
- Minimum Price: Increased to $195,000 from $99,000 in 2023, suggesting a higher entry point for buyers.
- Maximum Price: Surged to $1,900,000 from $1,200,000, signaling a recovery in luxury property transactions.
- Average Price: Rose to $587,853 from $478,936, reflecting growth in mid-tier market activity.
- Median Price: Jumped to $569,900 from $460,000, indicating strengthened overall market valuations.
Property Features
- Bedrooms: Increased to an average of 4 bedrooms from 3, suggesting a preference for larger family-friendly homes.
- Bathrooms: Remained steady at 3 bathrooms, meeting common buyer demands.
- Square Footage:
- Minimum SqFt: Increased to 1,095 sq. ft. from 868, offering slightly larger entry-level homes.
- Maximum SqFt: Increased to 5,344 sq. ft. from 4,630, showcasing more options for luxury and spacious living.
- Average SqFt: Rose to 2,600 sq. ft. from 2,216, reflecting buyer preferences for larger spaces.
- Median SqFt: Climbed to 2,580 sq. ft. from 2,120, further cementing the trend toward bigger homes.
Lot Size
- Minimum Lot Size: Remained nearly unchanged at 0.172 acres compared to 2023’s 0.173 acres.
- Maximum Lot Size: Shifted significantly to 78.000 acres, down from the extreme 2023 outlier of 91,868 acres.
- Average Lot Size: Decreased to 6.053 acres from 2,186.268 acres, normalizing after being skewed by an outlier last year.
Market Dynamics
-
Days on Market (DOM):
- Average DOM: Increased to 113 days from 87, indicating a notable slowdown in sales processes.
- Maximum DOM: Skyrocketed to 676 days from 402, further highlighting extended selling periods for certain properties.
-
Price Ratios:
- ClsPr/LstPr (Close Price to Listing Price): Improved slightly to 98.20% from 97.05%, reflecting closer alignment between listing prices and final sales.
- ClsPr/OLP (Close Price to Original Listing Price): Increased to 95.16% from 92.71%, showing slightly more accurate initial pricing strategies.
-
Price Per Square Foot (Pr$/SqFt): Adjusted higher, settling at $225.83 from $219.65, reflecting gradual price appreciation alongside increased average home sizes.
Year Built
- Oldest Property Built: Rose to 1950 from 1910, indicating a narrowing of older inventory options.
- Newest Property Built: Remained at 2024, with new developments active for modern buyers.
- Average Year Built: Increased to 2008 from 1998, indicating a gradual preference for relatively newer homes.
- Median Year Built: Increased to 2017 from 2013, further reinforcing this trend for newer properties.
Key Trends and Observations
- Luxury Market Rebounds: Higher maximum prices and larger homes reflect renewed activity in high-end segments.
- Bigger Homes Preferred: The average and median square footage and bedroom count increased, signaling demand for more spacious properties.
- Extended Sales Periods: The dramatic rise in DOM indicates cautious buyer behavior and more negotiation time in transactions.
- Pricing Alignments: Improvements in listing-to-close price ratios suggest sellers re-calibrating pricing strategies in line with market realities.
The 2024 real estate market in Blue Ridge, Texas displayed resilience, with stronger mid-market and luxury activity contrasting against slower transactions and rising costs in utilities and financing. This year showcased the adaptability of buyers and sellers within a dynamic housing environment.
Summary of Real Estate Market Analysis for Blue Ridge, TX in 2024
The 2024 real estate market in Blue Ridge, Texas, showcased a year of resilience and transformation as it adapted to shifting economic realities. While the total number of closed sales declined to 43 homes, the market displayed significant growth in property values, with increased average and median prices signaling a steady resurgence, particularly in the luxury segment. Larger homes with an average of 4 bedrooms and 2,600 sqft dominated buyer preferences, reflecting increased demand for family-friendly features and spacious living.
Despite the reduced average mortgage rate of 6.90%, affordability remained a central concern for buyers, as rising home prices paired with higher utility costs created an added layer of deliberation. Extended days on the market, averaging 113 days, highlighted the cautious approach many buyers adopted. Sellers responded with more refined pricing strategies, evident in the improved close-to-list and original price ratios, fostering a slightly more balanced environment.
Blue Ridge’s 2024 housing market offered valuable opportunities for both buyers and sellers. HomeBuyers were able to explore a growing inventory of larger homes and recover confidence in luxury markets, while home sellers achieved more substantial valuations for their properties. Despite economic pressures, the market illustrated adaptability and optimism for continued progress in the coming years.
Why Statistics Data is Important
Understanding past market data is essential for making informed decisions in today’s real estate landscape. Historical statistics provide a foundational perspective on trends, aiding in fair pricing and negotiation.
Unlock Exceptional Service!
Assistance with all your real estate needs in the Dallas-Fort Worth area is just a click or call away. Reach out at 214-940-8149 or connect through the links below.

Oleg Sedletsky REALTOR® in Blue Ridge, Texas. Call/Text 214.940.8149
Greetings! I’m Oleg Sedletsky, and I’m excited to introduce myself as your go-to full-time licensed Texas REALTOR® and Mortgage Loan Originator.
I proudly represent JPAR® – Real Estate Brokerage as a REALTOR® and Utopia Mortgage LLC as a Mortgage Loan Originator! My designations and certifications reflect my dedication to helping you achieve your real estate goals in Blue Ridge, TX and other locations in the vibrant Dallas-Fort Worth area!
My commitment to ongoing professional development means I’m always enhancing my skills to serve you better. You can count on me as your trusted expert throughout your real estate journey. Plus, I’m fluent in English, Ukrainian, and Russian and ready to assist you every step of the way!
It’s All About You and Your Real Estate Dreams!
My mission is to serve you! With my knowledge and expertise, I’m here to help you achieve all your real estate goals and turn your dreams into reality!
I’m passionate about helping buyers and sellers navigate the exciting real estate landscape in Blue Ridge, Texas! Whether you’re searching for your dream home, exploring land options, or looking for commercial properties, my Real Estate Services have you covered.
Contact me today for all your real estate needs in Blue Ridge, Texas! Call/text 214-940-8149
Discover Yearly Real Estate Market Trends for Blue Ridge, TX
2003-2010
Blue Ridge, TX Real Estate Market in 2003
Blue Ridge, TX Real Estate Market in 2004
Blue Ridge, TX Real Estate Market in 2005
Blue Ridge, TX Real Estate Market in 2006
Blue Ridge, TX Real Estate Market in 2007
Blue Ridge, TX Real Estate Market in 2008
2011-2020
Blue Ridge, TX Real Estate Market in 2011
Blue Ridge, TX Real Estate Market in 2012
Blue Ridge, TX Real Estate Market in 2013
Blue Ridge, TX Real Estate Market in 2014
Blue Ridge, TX Real Estate Market in 2015
Blue Ridge, TX Real Estate Market in 2016
Blue Ridge, TX Real Estate Market in 2017
Blue Ridge, TX Real Estate Market in 2018
This market analysis is intended solely for educational purposes. This market analysis is based on data sourced from NTREIS, Inc. This analysis is exclusively focused on single-family homes and does not account for other property types. The total number of real estate transactions within the specified period and location may vary. Data accuracy cannot be guaranteed due to potential input errors made by NTREIS users. This market analysis does not account for all new construction home sales. If you need detailed information about recorded property sales or other public records, please contact the appropriate city or county office.
Blue Ridge, TX Real Estate: 2023 Analysis of the Single-Family Residential Housing Market
The 2023 real estate market in Blue Ridge, TX faced a dynamic year under significant economic challenges.
Factors such as increased mortgage rates and inflationary pressures shaped buyer activity, while slower sales cycles and contractions in property values reflected a shift in priorities. With 49 single-family homes closed, Blue Ridge’s housing market remained resilient, balancing affordability concerns with adaptive homebuyer strategies.
Key Takeaways and Trends from Blue Ridge’s 2023 Real Estate Market
Pricing Range: Price metrics shifted in 2023, with reductions in both minimum and maximum prices. The decline in maximum prices indicated reduced luxury market activity, while the lower minimum price offered affordability to new buyers.
Market Efficiency: The market experienced longer average DOM and reduced price ratios, reflecting slower movement and increased buyer-seller negotiations.
Unique Outliers: An extraordinary property with 91,868 acres skewed lot-size averages significantly, showcasing unusual trends in high-value land deals.
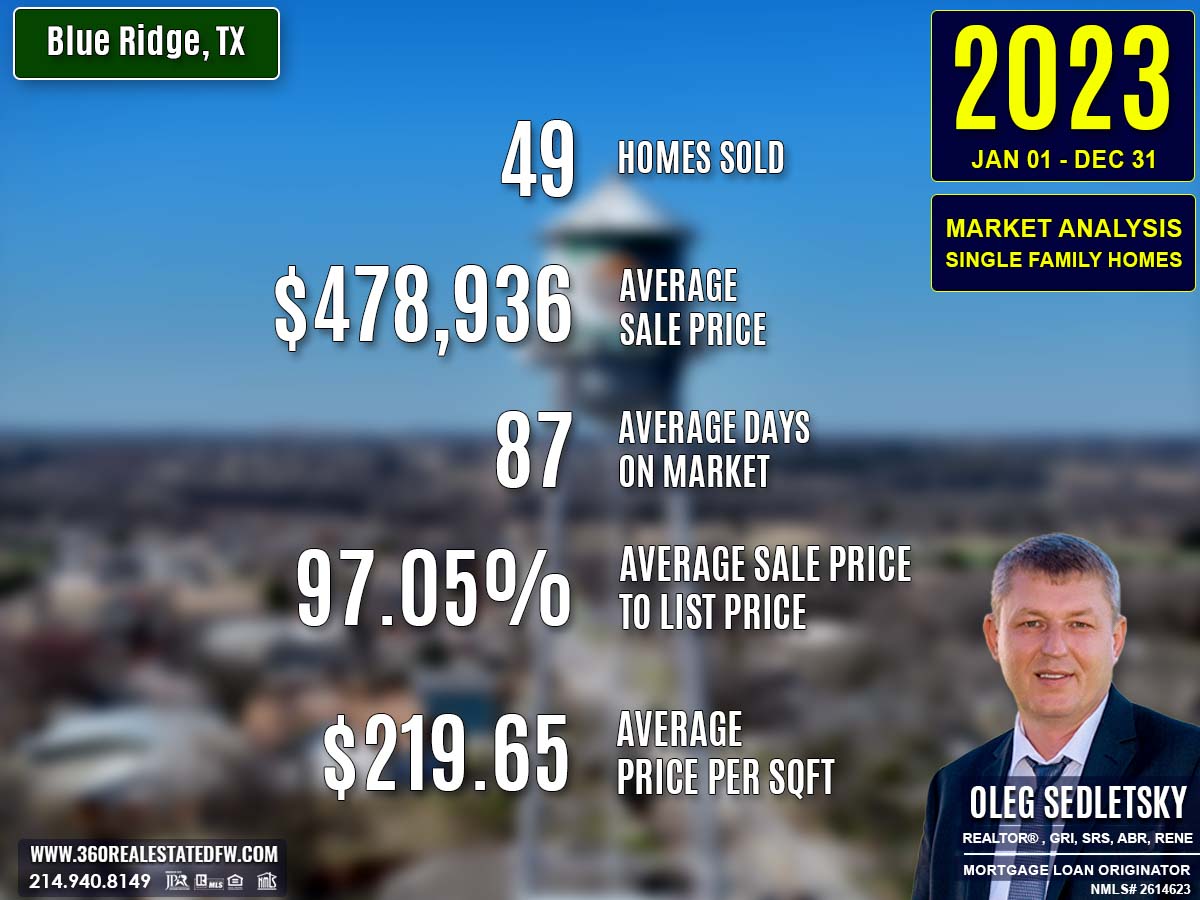
Total Homes Closed
The market recorded 49 homes sold in 2023, a decline from the 53 homes sold the previous year. This reduced activity reflects the economic pressures faced by both buyers and sellers, along with changing market dynamics.
Property Pricing Insights
- Minimum Price: Dropped to $99,000 from $115,000 in 2022, providing more affordable options for entry-level buyers.
- Maximum Price: Declined sharply to $1,200,000 compared to 2022’s $1,750,000, showcasing a significant slowdown in luxury property transactions.
- Average Price: Fell to $478,936, down from $578,177 in 2022, highlighting contractions in the mid-tier market.
- Median Price: Decreased to $460,000 from $599,000, reflecting lowered price points across the spectrum.
Property Size and Features
Bedrooms and Bathrooms
- Average Bedrooms: Declined to 3 bedrooms, compared to 4 in 2022, indicating smaller home preferences.
- Average Bathrooms: Held steady at 3 bathrooms, maintaining practicality for families.
Square Footage
- Minimum Size: Increased to 868 sq. ft., offering larger starter-home options for buyers.
- Maximum Size: Reduced to 4,630 sq. ft., highlighting fewer larger luxury homes.
- Average Size: Decreased to 2,216 sq. ft., down from 2,394 in 2022, showing a moderate trend toward downsized living.
- Median Size: Dropped to 2,120 sq. ft., signifying broader trends toward smaller homes in the mid and entry-level market.
Lot Size
- Average Lot Size: Grew dramatically to 2,186.268 acres, influenced significantly by the inclusion of a unique outlier property.
- Minimum Lot Size: Increased slightly to 0.173 acres, offering more spacious starter lots.
- Maximum Lot Size: Skyrocketed to 91,868 acres, an extreme increase due to a single unusual property transaction.
Market Dynamics
-
Days on Market (DOM):
- Average DOM: Increased to 87 days, over double the 30-day average in 2022, indicating slower transaction cycles.
- Maximum DOM: Reached 402 days, reflecting challenges in selling certain listings.
-
Price Ratios:
- ClsPr/LstPr (Close Price to Listing Price): Dropped to 97.05%, signaling growing buyer leverage in negotiations.
- ClsPr/OLP (Close Price to Original Listing Price): Declined sharply to 92.71%, illustrating increased seller flexibility on initial pricing.
-
Price Per Square Foot (Pr$/SqFt): Dropped to $219.65, down from $245.69 in 2022, showing cooling valuation trends under economic constraints.
Insights into the Most Expensive Blue Ridge, TX Property Sold in 2023
The highest-value property sold in 2023 reflected luxury living, despite adjustments in the high-end market.
Key Details:
- Price: $1,200,000
- Bedrooms: 4
- Bathrooms: 4 (3 full, 1 half)
- Square Footage: 4,630 sq. ft.
- Price Per Square Foot: $259.18
- Lot Size: 6.639 acres
- Days on Market (DOM): 16 days
- ClsPr/LstPr Ratio: 92.66%
- Year Built: 2008
This property combined ample interior space, modern architecture, and a generously-sized lot, showcasing its appeal despite a declining luxury market.

Economic context
Average Electricity Costs in Dallas-Fort Worth in 2023
The average electricity cost decreased slightly to $0.17/kWh, providing marginal relief for households.
Texas Average Gas Prices in 2023
Gas prices dropped to $3.06 per gallon, reducing everyday transportation costs for buyers.
Average 30-Year Fixed Mortgage Rate in 2023
The average 30-year fixed mortgage rate in 2023 climbed to 7.00%, marking a significant increase from previous years. This sharp rise in rates had a considerable impact on home affordability, leading to higher monthly payments and reduced borrowing power for many potential buyers.
First-time homebuyers and those targeting mid-market properties faced challenges, often having to adjust budgets or reconsider their options to align with these new financial realities. Despite this, determined buyers adapted, highlighting the enduring desire for homeownership.
Curious about today’s mortgage rates and the home you can comfortably afford?
Submit a no-obligation mortgage application today and get pre-approved to determine your budget and take the first step toward homeownership with confidence.
Summary of Differences Between 2022 and 2023 Real Estate Data for Blue Ridge, TX
The comparison between the 2023 and 2022 real estate data for Blue Ridge, TX reveals significant shifts in property values, lot sizes, and overall market dynamics, reflecting an evolving market under economic pressures.
Property Pricing
- Minimum Price: Dropped to $99,000 in 2023 from $115,000 in 2022, signaling increased entry-level affordability.
- Maximum Price: Declined considerably to $1,200,000 from $1,750,000, indicating a tapering in the luxury market.
- Average Price: Decreased to $478,936 in 2023 from $578,177, suggesting a contraction in mid-tier property valuations.
- Median Price: Fell to $460,000 from $599,000 in 2022, reflecting stabilized market activity at lower price points.
Property Features
- Bedrooms: Average dropped to 3 bedrooms from 4, signaling a trend toward smaller homes.
- Bathrooms: Remained steady at 3 bathrooms, aligning with general buyer preferences for practicality.
- Square Footage:
- Minimum SqFt: Increased to 868 sq. ft. from 672, providing larger options for entry-level buyers.
- Maximum SqFt: Dropped slightly to 4,630 sq. ft. from 4,945, reducing high-end property sizes.
- Average SqFt: Fell to 2,216 sq. ft. from 2,394, illustrating a modest decline in property size preferences.
- Median SqFt: Reduced to 2,120 sq. ft. from 2,202, consistent with downsizing trends.
Lot Size
- Minimum Lot Size: Grew slightly to 0.173 acres from 0.130, offering slightly larger starter-home plots.
- Maximum Lot Size: Skyrocketed to 91,868 acres from 8,783, due to a substantial outlier property.
- Average Lot Size: Ballooned to 2,186.268 acres from 172.046 acres, heavily influenced by large-property transactions in 2023.
Market Dynamics
- Days on Market (DOM):
- Average DOM: More than doubled to 87 days from 30, signaling a slowing in sales pace.
- Maximum DOM: Extended significantly to 402 days from 192, highlighting challenges in moving certain properties.
- ClsPr/LstPr Ratio: Decreased to 97.05% from 100.79%, reflecting increased buyer leverage in pricing negotiations.
- ClsPr/OLP Ratio: Declined sharply to 92.71% from 98.72%, indicating greater flexibility on original listing prices.
- Price Per Square Foot (Pr$/SqFt): Dropped to $219.65 from $245.69, suggesting a cooling in property valuation appreciation.
Year Built
- Oldest Property Built: Shifted back to 1910 from 1935, expanding the historical property inventory.
- Newest Property Built: Held steady at 2023, maintaining the inclusion of new construction.
- Average Year Built: Dropped to 1998 from 2006, reflecting a slight pivot towards older inventory.
- Median Year Built: Declined to 2013 from 2015, indicating adjustments in buyer preferences to slightly older homes.
Key Trends and Observations
- Mid-Market Decline: Both average and median prices reduced, suggesting affordability challenges impacted mid-tier transactions.
- Smaller Homes Prevail: The reduction in average square footage and bedrooms reflects a shift toward downsizing.
- Luxury Segment Slowdown: Declining maximum prices, square footage, and fewer high-end deals highlight moderation in the luxury market.
- Extended Marketing Periods: The significant increase in DOM suggests a slower market in 2023.
- Unique Outliers: The inclusion of a property with over 91,000 acres heavily influenced lot size averages, introducing an unusual market dynamic.
The 2023 real estate market in Blue Ridge, Texas adapted to heightened economic constraints, showcasing resilience with adjusted valuations and slower transactions while accommodating evolving buyer preferences.
Summary of Real Estate Market Analysis for Blue Ridge, TX in 2023
The 2023 real estate market in Blue Ridge, TX stood as a testament to resilience amidst challenging economic forces. While the number of homes closed declined slightly to 49, the market showcased adaptability to shifting buyer and seller priorities shaped by elevated mortgage rates and affordability concerns. Key developments included significant price moderation, particularly in the luxury and mid-tier segments, paired with adjustments in property features like smaller home sizes and reduced square footage to meet evolving buyer demands.
Market dynamics slowed, with homes spending an average of 87 days on market, signaling extended decision-making periods for homebuyers navigating affordability constraints. Home-Sellers responded by leveraging flexibility in close-to-list ratios, with metrics like 97.05% ClsPr/LstPr emphasizing competitive pricing strategies.
Amid these fluctuations, economic relief in electricity and gas costs offered households slight stability, counterbalancing the strain introduced by the 7.00% mortgage rate. Buyers sought newer opportunities at more appealing entry-level pricing points, while sellers remained engaged through adjustment to pricing and listing strategies.
Overall, Blue Ridge’s 2023 market highlighted opportunities for resourceful buyers and strategic sellers ready to adapt to a changing economic landscape. The year paved the way for a re-calibrated market, meeting affordability challenges while underscoring the enduring vitality of the local housing sector.
Why Statistics Data is Important
Understanding past market data is essential for making informed decisions in today’s real estate landscape. Historical statistics provide a foundational perspective on trends, aiding in fair pricing and negotiation.
Unlock Exceptional Service!
Assistance with all your real estate needs in the Dallas-Fort Worth area is just a click or call away. Reach out at 214-940-8149 or connect through the links below.
Oleg Sedletsky REALTOR® in Blue Ridge, Texas. Call/Text 214.940.8149
Greetings! I’m Oleg Sedletsky, and I’m excited to introduce myself as your go-to full-time licensed Texas REALTOR® and Mortgage Loan Originator.
I proudly represent JPAR® – Real Estate Brokerage as a REALTOR® and Utopia Mortgage LLC as a Mortgage Loan Originator! My designations and certifications reflect my dedication to helping you achieve your real estate goals in Blue Ridge, TX and other locations in the vibrant Dallas-Fort Worth area!
My commitment to ongoing professional development means I’m always enhancing my skills to serve you better. You can count on me as your trusted expert throughout your real estate journey. Plus, I’m fluent in English, Ukrainian, and Russian and ready to assist you every step of the way!
It’s All About You and Your Real Estate Dreams!
My mission is to serve you! With my knowledge and expertise, I’m here to help you achieve all your real estate goals and turn your dreams into reality!
I’m passionate about helping buyers and sellers navigate the exciting real estate landscape in Blue Ridge, Texas! Whether you’re searching for your dream home, exploring land options, or looking for commercial properties, my Real Estate Services have you covered.
Contact me today for all your real estate needs in Blue Ridge, Texas! Call/text 214-940-8149
Discover Yearly Real Estate Market Trends for Blue Ridge, TX
2003-2010
Blue Ridge, TX Real Estate Market in 2003
Blue Ridge, TX Real Estate Market in 2004
Blue Ridge, TX Real Estate Market in 2005
Blue Ridge, TX Real Estate Market in 2006
Blue Ridge, TX Real Estate Market in 2007
Blue Ridge, TX Real Estate Market in 2008
2011-2020
Blue Ridge, TX Real Estate Market in 2011
Blue Ridge, TX Real Estate Market in 2012
Blue Ridge, TX Real Estate Market in 2013
Blue Ridge, TX Real Estate Market in 2014
Blue Ridge, TX Real Estate Market in 2015
Blue Ridge, TX Real Estate Market in 2016
Blue Ridge, TX Real Estate Market in 2017
Blue Ridge, TX Real Estate Market in 2018
This market analysis is intended solely for educational purposes. This market analysis is based on data sourced from NTREIS, Inc. This analysis is exclusively focused on single-family homes and does not account for other property types. The total number of real estate transactions within the specified period and location may vary. Data accuracy cannot be guaranteed due to potential input errors made by NTREIS users. This market analysis does not account for all new construction home sales. If you need detailed information about recorded property sales or other public records, please contact the appropriate city or county office.
Blue Ridge, TX Real Estate: 2022 Analysis of the Single-Family Residential Housing Market
The 2022 real estate market in Blue Ridge, Texas faced shifting dynamics as economic pressures, including rising mortgage rates and utility costs, influenced buyer and seller behaviors. Despite these challenges, the market demonstrated resilience, with 53 single-family homes sold and steady appreciation in property values, particularly in the luxury segment. Blue Ridge‘s market remained attractive for both entry-level and high-end buyers amid shifting trends and preferences.
Key Takeaways and Trends from Blue Ridge’s 2022 Real Estate Market
Pricing Range: An increase in both the minimum and maximum property prices highlighted a growing valuation across all market segments.
Market Efficiency: Slightly longer DOM and marginally reduced close-to-list ratios signaled cooling market intensity, although overall efficiency remained high.
Unique Outliers: The inclusion of ultra-large properties notably inflated average lot sizes while demonstrating the appeal of luxury acreage for premium buyers.
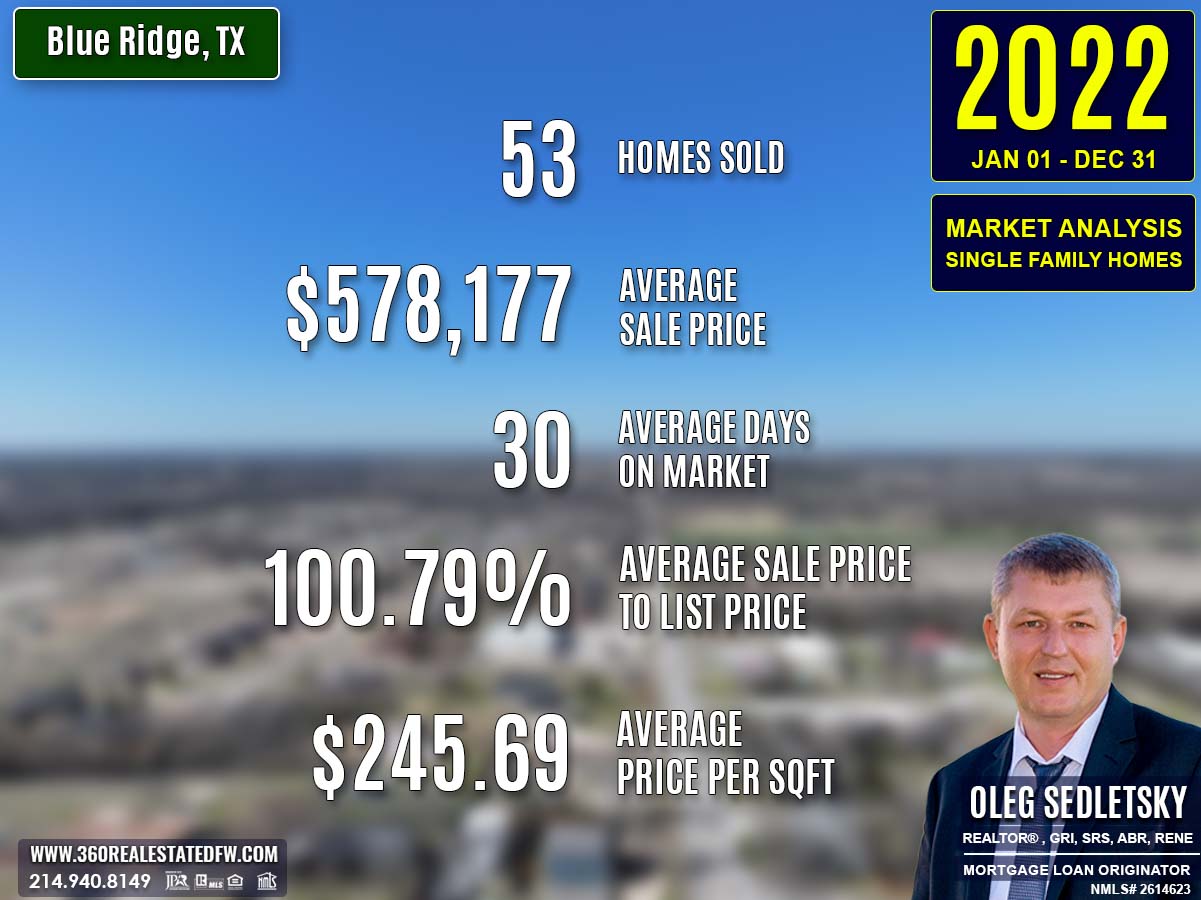
Total Homes Closed
Blue Ridge’s real estate sector saw 53 closed transactions in 2022, slightly down from 55 in 2021. This moderate decline reflects a market adjusting to external pressures, such as rising interest rates, while still maintaining considerable activity.
Property Pricing Insights
The year saw remarkable growth in property values, with significant increases across minimum, maximum, average, and median prices:
- Minimum Price: Rose to $115,000, representing higher barriers of entry for buyers.
- Maximum Price: Reached a new pinnacle at $1,750,000, further expanding the luxury market.
- Average Price: Increased substantially to $578,177, driven by higher-tier transactions.
- Median Price: Climbed to $599,000, indicating a robust and competitive mid-market segment.
Property Size and Features
Bedrooms and Bathrooms
- Bedrooms: Maintained the family-friendly standard of an average 4 bedrooms.
- Bathrooms: Averaged 3 bathrooms, ensuring practical convenience for households.
Square Footage
- Minimum Size: Decreased to 672 sq. ft., offering smaller entry-level options.
- Maximum Size: Expanded to a generous 4,945 sq. ft., catering to luxury buyers.
- Average Size: Increased modestly to 2,394 sq. ft., supporting diversified buyer needs.
- Median Size: Grew to 2,202 sq. ft., reflecting a steady trend toward spacious homes.
Lot Size
- Minimum Lot Size: Decreased to 0.13 acres, suggesting a push for denser developments.
- Maximum Lot Size: Skyrocketed to 8,783 acres, driven by an outlier property.
- Average Lot Size: Surged to 172.046 acres, highlighting the influence of larger land transactions.
Market Dynamics
Days on Market (DOM)
- Average DOM: rose slightly to 30 days, showing a marginal slowdown.
- Maximum DOM: Extended to 192 days, reflecting longer timelines for high-end properties.
Price Ratios
- ClsPr/LstPr (Close Price to Listing Price): Slightly declined to 100.79%, indicating slightly moderated competition.
- ClsPr/OLP (Close Price to Original Listing Price): Declined to 98.72%, reflecting increased flexibility in negotiations.
Price Per Square Foot
- Pr$/SqFt skyrocketed to $245.69, up from $186.47 in 2021, showing rapid growth in property valuation.
Insights into the Most Expensive Blue Ridge, TX Property Sold in 2022
The standout sale of 2022 was a stunning high-luxury property that showcased the market’s premium segment strength.
Key Details:
- Price: $1,750,000
- Bedrooms: 4
- Bathrooms: 4 (3 full, 1 half)
- Square Footage: 3,341 sq. ft.
- Price Per Square Foot: $523.80
- Lot Size: 66.922 acres
- Days on Market (DOM): 24 days
- ClsPr/LstPr Ratio: 100.00%
- Year Built: 1999
This property perfectly exemplified luxury living, with expansive acreage and a potent combination of modern amenities and high-quality construction.
Economic context
Average Electricity Costs in Dallas-Fort Worth in 2022
The average electricity rate rose to $0.18/kWh, contributing to increased monthly utility expenses.
Texas Average Gas Prices in 2022
Gas prices peaked at $3.47/gallon, escalating transportation and heating costs across households.
Average 30-Year Fixed Mortgage Rate in 2022
The average 30-year fixed mortgage rate in 2022 climbed to 5.53%, marking a notable increase from previous years. This rate hike had a significant impact on home affordability, raising monthly payments for buyers and influencing buying power, particularly for first-time homebuyers and those considering high-value properties. Despite these challenges, the desire for homeownership remained strong, with buyers adjusting budgets and focusing on properties that met lifestyle priorities.
Curious about today’s mortgage rates and the home you can comfortably afford?
Submit a no-obligation mortgage application today and get pre-approved to determine your budget and take the first step toward homeownership with confidence.
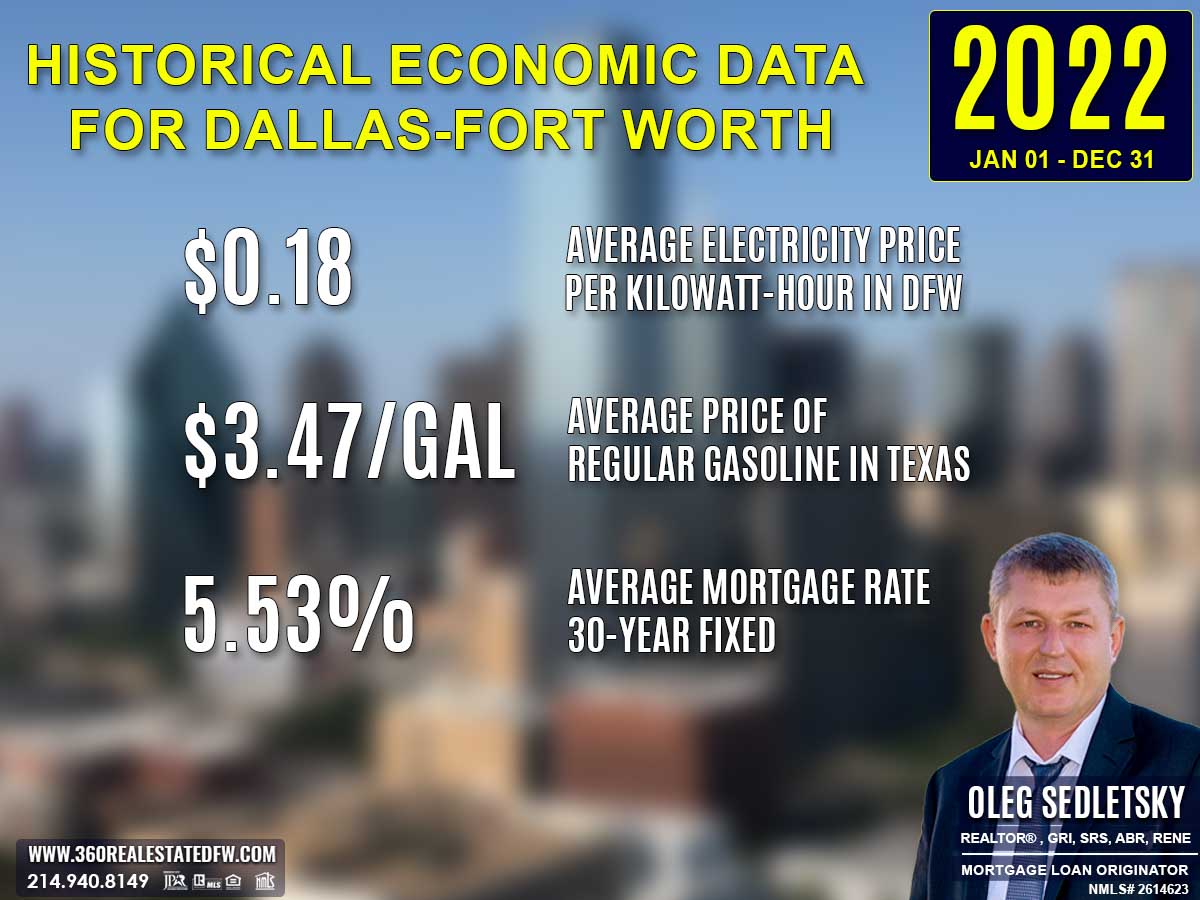
Summary of Differences Between 2021 and 2022 Real Estate Data for Blue Ridge, TX
The comparison between 2022 and 2021 real estate data for Blue Ridge, TX reveals notable shifts in housing metrics, including property values, lot sizes, and market dynamics. Below are the key differences:
Property Pricing
- Minimum Price: Increased significantly to $115,000 in 2022 from $86,116 in 2021, signaling higher entry-level home prices.
- Maximum Price: Set a new record at $1,750,000, up from $1,650,000 in 2021, indicating continued luxury market growth.
- Average Price: Jumped sharply to $578,177, compared to $432,805 the previous year, showcasing robust appreciation in property values.
- Median Price: Rose to $599,000 from $396,900, reflecting a strengthened mid-tier market.
Property Features
- Bedrooms: Properties in both years averaged 4 bedrooms, showing consistency in family-oriented housing.
- Bathrooms: Remained steady with an average of 3 bathrooms across both years.
- Square Footage:
- Minimum Size: Decreased to 672 sq. ft. from 900 sq. ft., offering smaller entry-level options in 2022.
- Maximum Size: Grew to 4,945 sq. ft. from 4,253 sq. ft., emphasizing availability of larger luxury homes.
- Average Size: Increased slightly to 2,394 sq. ft., up from 2,343 sq. ft., confirming a preference for moderate space expansions.
- Median Size: Increased to 2,202 sq. ft., up from 2,080 sq. ft., indicating a steady shift towards more spacious homes.
Lot Size
- Minimum Lot Size: Shrunk to 0.13 acres from 0.178 acres in 2021, suggesting a denser housing market for entry-level buyers.
- Maximum Lot Size: Skyrocketed to 8,783 acres from 34.200 acres, a dramatic rise driven by outlier properties.
- Average Lot Size: Expanded dramatically to 172.046 acres from 3.949 acres due to the inclusion of massive landholdings.
Market Dynamics
- Days on Market (DOM):
- Average DOM: Increased slightly to 30 days from 28, signaling marginally longer sales cycles.
- Maximum DOM: Extended to 192 days from 147, showing slower high-end transactions.
- ClsPr/LstPr Ratio: Declined slightly to 100.79% from 101.00%, reflecting a slight shift toward more balanced transaction pricing.
- ClsPr/OLP Ratio: Also decreased to 98.72% from 99.60%, illustrating a marginal widening in negotiation flexibility.
- Price Per Square Foot (Pr$/SqFt): Surged to $245.69 from $186.47, revealing a substantial increase in property values.
Year Built
- Oldest Property Built: Shifted to 1935 from 1945, showing the inclusion of older housing stock.
- Newest Property Built: Advanced to 2022 from 2021, reflecting the entry of new construction.
- Average Year Built: Increased slightly to 2006 from 2003, illustrating a trend toward younger housing inventory.
- Median Year Built: Held steady at 2015, confirming consistent modern home offerings.
Key Trends and Insights
- Luxury Market Growth: The increase in maximum price and price per square foot signals significant expansion in the high-end property segment.
- Land Outliers: The inclusion of a property with nearly 8,783 acres dramatically shifted lot size averages.
- Market Efficiency: Marginal increases in DOM and slight decreases in close-to-list and original price ratios indicate cooling from the intense competition seen in 2021.
- Economic Pressure: Rising mortgage rates and utility costs likely influenced buyer behavior while driving value appreciation in the housing market.
The 2022 real estate market in Blue Ridge, TX amplified its luxury offerings, sustained appreciation in values, and showcased resilience amid economic pressures, even as market dynamics began to shift slightly toward balance.
Summary of Real Estate Market Analysis for Blue Ridge, TX in 2022
The 2022 real estate market in Blue Ridge, TX, demonstrated resilience and adaptability amidst significant economic challenges. Rising mortgage rates, climbing utility costs, and higher gas prices played a pivotal role in shaping buyer and seller behaviors. Despite these pressures, the market thrived, with 53 homes sold and substantial growth in property values across all segments.
Key trends included the impressive performance of the luxury market, as reflected by the record-setting $1.75 million home sale and the sharp rise in price per square foot to $245.69. These metrics underscored the strong demand for premium properties while highlighting the growing appeal of mid-market homes, as indicated by the rise in median pricing to $599,000.
For homebuyers, the challenges of higher monthly costs required strategic decision-making, including a focus on functional and value-driven properties. Home-Sellers, on the other hand, benefited from high competition and rising valuations, particularly in the high-end sector. While market dynamics saw slight moderation, with an increase in average days on the market, transaction efficiency overall remained strong.
The 2022 Blue Ridge, TX, real estate market successfully navigated an evolving economic landscape, continuing to attract active buyers and delivering opportunities for profitable transactions for sellers. These results reflect not only the adaptability of the market but also its sustained appeal as a desirable destination for diverse buyers.
Why Statistics Data is Important
Understanding past market data is essential for making informed decisions in today’s real estate landscape. Historical statistics provide a foundational perspective on trends, aiding in fair pricing and negotiation.
Unlock Exceptional Service!
Assistance with all your real estate needs in the Dallas-Fort Worth area is just a click or call away. Reach out at 214-940-8149 or connect through the links below.
Oleg Sedletsky REALTOR® in Blue Ridge, Texas. Call/Text 214.940.8149
Greetings! I’m Oleg Sedletsky, and I’m excited to introduce myself as your go-to full-time licensed Texas REALTOR® and Mortgage Loan Originator.
I proudly represent JPAR® – Real Estate Brokerage as a REALTOR® and Utopia Mortgage LLC as a Mortgage Loan Originator! My designations and certifications reflect my dedication to helping you achieve your real estate goals in Blue Ridge, TX and other locations in the vibrant Dallas-Fort Worth area!
My commitment to ongoing professional development means I’m always enhancing my skills to serve you better. You can count on me as your trusted expert throughout your real estate journey. Plus, I’m fluent in English, Ukrainian, and Russian and ready to assist you every step of the way!
It’s All About You and Your Real Estate Dreams!
My mission is to serve you! With my knowledge and expertise, I’m here to help you achieve all your real estate goals and turn your dreams into reality!
I’m passionate about helping buyers and sellers navigate the exciting real estate landscape in Blue Ridge, Texas! Whether you’re searching for your dream home, exploring land options, or looking for commercial properties, my Real Estate Services have you covered.
Contact me today for all your real estate needs in Blue Ridge, Texas! Call/text 214-940-8149
Discover Yearly Real Estate Market Trends for Blue Ridge, TX
2003-2010
Blue Ridge, TX Real Estate Market in 2003
Blue Ridge, TX Real Estate Market in 2004
Blue Ridge, TX Real Estate Market in 2005
Blue Ridge, TX Real Estate Market in 2006
Blue Ridge, TX Real Estate Market in 2007
Blue Ridge, TX Real Estate Market in 2008
2011-2020
Blue Ridge, TX Real Estate Market in 2011
Blue Ridge, TX Real Estate Market in 2012
Blue Ridge, TX Real Estate Market in 2013
Blue Ridge, TX Real Estate Market in 2014
Blue Ridge, TX Real Estate Market in 2015
Blue Ridge, TX Real Estate Market in 2016
Blue Ridge, TX Real Estate Market in 2017
Blue Ridge, TX Real Estate Market in 2018
This market analysis is intended solely for educational purposes. This market analysis is based on data sourced from NTREIS, Inc. This analysis is exclusively focused on single-family homes and does not account for other property types. The total number of real estate transactions within the specified period and location may vary. Data accuracy cannot be guaranteed due to potential input errors made by NTREIS users. This market analysis does not account for all new construction home sales. If you need detailed information about recorded property sales or other public records, please contact the appropriate city or county office.
Blue Ridge, TX Real Estate: 2021 Analysis of the Single-Family Residential Housing Market
The 2021 real estate market in Blue Ridge, TX continued to thrive despite the ongoing challenges of the second year of COVID-19.
The market demonstrated remarkable growth and increased activity, with 55 homes closed—the highest total in recent years. This year highlighted skyrocketing property values, improved market dynamics, and greater buyer confidence driven by evolving preferences shaped by the pandemic.
Key Takeaways and Trends from Blue Ridge’s 2021 Real Estate Market
Pricing Range: Prices spanned from $86,116 to $1,650,000, with a significant boost in luxury property values driving market activity upward.
Market Efficiency: Shortened average DOM, higher close-to-list ratios, and competitive price-per-square-foot metrics reflect a seller’s market with intense buyer interest.
Unique Outliers: The explosive rise in maximum price and $405/sq. ft. profile of the most expensive property signals growing demand for well-designed, luxury homes in Blue Ridge, Texas.
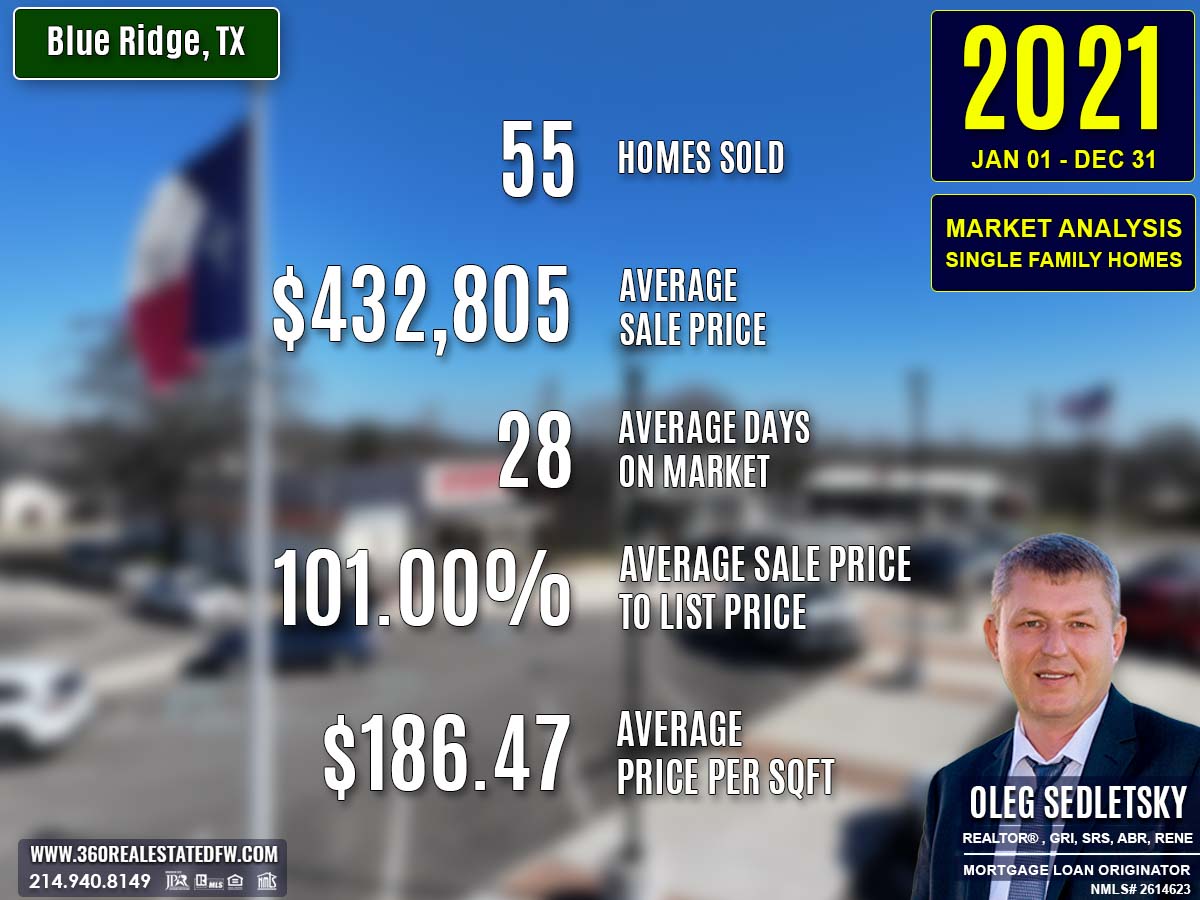
Total Homes Closed
Blue Ridge’s real estate sector saw 55 single-family homes close in 2021, a significant increase from 41 homes in 2020. This rise in transactions underscores a robust increase in market activity and demand for properties amidst shifting lifestyle preferences during the ongoing pandemic.
Property Pricing Insights
The pricing landscape in 2021 showcased robust growth, especially in the luxury segment:
- Minimum Price: Increased to $86,116, indicating higher entry-level home valuations.
- Maximum Price: Surged to a staggering $1,650,000, more than doubling the highest price of 2020, signaling strong demand for high-end properties.
- Average Price: Rose to $432,805, up from $334,746 in 2020, highlighting steady growth in property values.
- Median Price: Increased to $396,900, illustrating sustained strength in the mid-market segment.
Property Size and Features
Bedrooms and Bathrooms
- Bedrooms: Most homes featured 4 bedrooms, meeting family lifestyle requirements.
- Bathrooms: Properties averaged 3 bathrooms, maintaining a balance between convenience and functionality.
Square Footage
- Minimum Size: Expanded slightly to 900 sq. ft. from 888 sq. ft. in 2020, offering slightly larger options for entry-level buyers.
- Maximum Size: Decreased marginally to 4,253 sq. ft. from 4,438 sq. ft., indicating a small shift in ultra-large luxury homes.
- Average Size: Declined to 2,343 sq. ft., from 2,391 sq. ft., reflecting efficient use of space without compromising functionality.
- Median Size: Dropped to 2,080 sq. ft., down from 2,425 sq. ft., showcasing a preference for mid-sized, more manageable homes.
Lot Size
- Minimum Lot Size: Declined to 0.178 acres, down from 0.254 acres, reflecting denser development.
- Maximum Lot Size: Increased to 34.200 acres, from 30.109 acres, catering to buyers seeking expansive outdoor properties.
- Average Lot Size: Rose to 3.949 acres, reinforcing the growing importance of outdoor spaces in the COVID-19 era.
Market Dynamics
Days on Market (DOM)
- Minimum DOM: Dropped sharply to just 1 day, highlighting intense competition for desirable listings.
- Maximum DOM: Halved to 147 days, compared to 277 days in 2020, showing a significant reduction in high-end transaction timelines.
- Average DOM: Reduced significantly to 28 days from 81 days, reflecting a fast-paced market driven by high buyer demand.
Price Ratios
- ClsPr/LstPr (Close Price to Listing Price): Reached an impressive 101%, showing that properties often sold above asking price.
- ClsPr/OLP (Close Price to Original Listing Price): Increased to 99.60%, narrowing negotiation margins.
Price Per Square Foot
- Pr$/SqFt: Skyrocketed to $186.47, up from $143.29 in 2020, illustrating the rapid rise in valuations.
Insights into the Most Expensive Blue Ridge, TX Property Sold in 2021
The most expensive property sold in 2021 was a testament to the market’s luxury growth.
Key Details:
- Price: $1,650,000
- Bedrooms: 3
- Bathrooms: 3 (2 full, 1 half)
- Square Footage: 4,074 sq. ft.
- Price Per Square Foot: $405.01
- Lot Size: 20 acres
- Days on Market (DOM): 12 days
- ClsPr/LstPr Ratio: 92.18%
- Year Built: 2018
This property exemplified high-end living with its expansive interior, premium outdoor space, and impressive build quality.
Economic context
Average Electricity Costs in Dallas-Fort Worth in 2021
The average electricity cost rose slightly to $0.14 per kWh, reflecting general inflation in utility expenses.
Texas Average Gas Prices in 2021
Average gas prices jumped to $2.65 per gallon from $1.82 in 2020, increasing transportation and heating costs for homeowners.
Average 30-Year Fixed Mortgage Rate in 2021
The average 30-year fixed mortgage rate in 2021 dropped slightly to 3.15%, continuing to boost affordability for homebuyers. This marginal decline from the previous year’s rates encouraged many to take advantage of lower financing costs, enabling greater purchasing power and the ability to secure higher-value homes. HomeBuyers capitalized on this favorable environment, helping sustain strong demand in the market, even amid the uncertainties of the second year of the pandemic.
Curious about today’s mortgage rates and the home you can comfortably afford?
Submit a no-obligation mortgage application today and get pre-approved to determine your budget and take the first step toward homeownership with confidence.
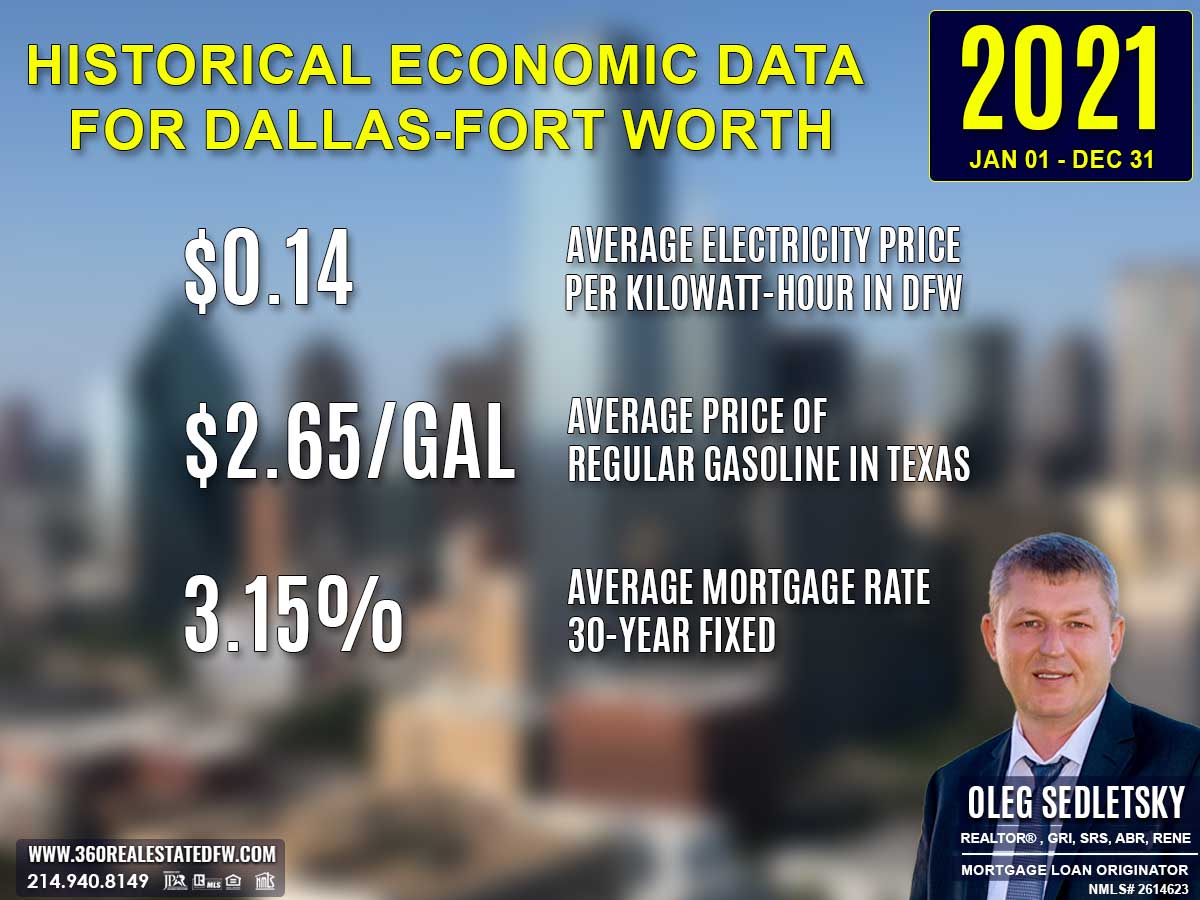
Summary of Differences Between 2020 and 2021 Real Estate Data for Blue Ridge, TX
The comparison between 2021 and 2020 real estate data for Blue Ridge, Texas underscores significant growth and an increasingly competitive market in 2021. Below are the key differences:
Property Pricing
- Minimum Price: Increased substantially to $86,116 from $61,300 in 2020, indicating a higher entry point for buyers.
- Maximum Price: More than doubled to $1,650,000 from $695,000, showcasing an extraordinary boost in the luxury segment.
- Average Price: Rose sharply to $432,805 from $334,746, reflecting robust demand across higher-priced homes.
- Median Price: Jumped to $396,900 from $359,000, signifying a steady rise in mid-market values.
Property Features
- Bedrooms and Bathrooms: Remained consistent on average at 4 bedrooms and 3 bathrooms in both years; no major shifts in these key features.
- Square Footage:
- Minimum slightly expanded to 900 sq. ft. from 888 sq. ft., offering larger entry-level homes.
- Maximum decreased to 4,253 sq. ft. from 4,438 sq. ft., reflecting a modest reduction in the largest homes sold.
- Average contracted slightly to 2,343 sq. ft., down from 2,391 sq. ft., aligning with buyer preferences for practical spaces.
- Median size declined more notably to 2,080 sq. ft., down from 2,425 sq. ft., reinforcing the shift toward more mid-sized properties.
Lot Size
- Minimum Lot Size: Decreased to 0.178 acres from 0.254 acres, suggesting slightly denser property developments.
- Maximum Lot Size: Increased from 30.109 acres to 34.200 acres, offering larger plots for premium homes.
- Average Lot Size: Increased significantly to 3.949 acres from 3.571 acres, illustrating a greater emphasis on outdoor living spaces.
Market Dynamics
-
Days on Market (DOM):
- Minimum DOM: Dropped dramatically to 1 day from 3 days, highlighting intense competition and faster sales for desirable properties.
- Maximum DOM: Shortened substantially to 147 days from 277 days, reflecting faster turnover even for high-end homes.
- Average DOM: Plummeted to 28 days from 81 days, signaling a significantly more efficient market.
-
ClsPr/LstPr Ratio: Increased to a stellar 101% from 96.95%, illustrating a highly competitive seller’s market where many properties closed above asking price.
-
ClsPr/OLP Ratio: Improved to 99.60% from 95.06%, showcasing reduced negotiation gaps and firmer list prices.
-
Price Per Square Foot (Pr$/SqFt): Skyrocketed from $143.29 to $186.47, underscoring a sharp rise in the valuation of every square foot of property.
Year Built
- Oldest Property Built: Remained steady at 1945 in both years.
- Newest Property Built: Shifted to 2021 from 2020, reflecting the addition of new constructions entering the market.
- Average Year Built: Increased to 2003 from 2001, indicating a younger overall housing inventory.
- Median Year Built: Advanced to 2006 from 2015, highlighting the growing availability of newer homes.
Key Trends and Insights
- Luxury Surge: A standout increase in maximum price and price per square foot signals explosive growth in the luxury market, with buyers willing to invest in high-end properties.
- Market Efficiency: Tighter DOM, higher close-to-list price ratios, and faster sales cycles underline an exceptionally streamlined and competitive market environment.
- Mid-Tier Preference: A slight contraction in square footage and median lot size reflects buyer inclination toward manageable, well-sized homes alongside a demand for outdoor space.
The 2021 market in Blue Ridge, TX demonstrated higher competition, quicker sales, and expanding luxury opportunities, building on the foundation set in 2020.
Summary of Real Estate Market Analysis for Blue Ridge, TX in 2021
The 2021 real estate market in Blue Ridge, TX, showcased remarkable growth and resilience, achieving its highest level of activity in recent years with 55 homes closed. This surge highlights the adaptability of the market, driven by competitive pricing, high demand, and efficient transactions. Increased property values, particularly in the luxury segment, and a rise in median home prices to $396,900 underscored the market’s ongoing strength across all tiers.
The second year of the COVID-19 pandemic played a pivotal role in shaping homebuyer preferences, leading to a strong demand for homes with larger lot sizes, functional layouts, and outdoor spaces. These trends signified the growing importance of flexibility and comfort as remote work and at-home living continued.
For home-sellers, the market presented a golden opportunity; higher close-to-list price ratios and shorter average days on the market ensured seamless, profitable transactions. On the other hand, homebuyers capitalized on historically low mortgage rates of 3.15%, enabling them to secure dream properties amid rising prices.
Blue Ridge’s real estate market in 2021 exemplified adaptability, efficiency, and its ability to meet evolving buyer needs, setting the stage for further innovation and success in the coming years.
Why Statistics Data is Important
Understanding past market data is essential for making informed decisions in today’s real estate landscape. Historical statistics provide a foundational perspective on trends, aiding in fair pricing and negotiation.
Unlock Exceptional Service!
Assistance with all your real estate needs in the Dallas-Fort Worth area is just a click or call away. Reach out at 214-940-8149 or connect through the links below.
Oleg Sedletsky REALTOR® in Blue Ridge, Texas. Call/Text 214.940.8149
Greetings! I’m Oleg Sedletsky, and I’m excited to introduce myself as your go-to full-time licensed Texas REALTOR® and Mortgage Loan Originator.
I proudly represent JPAR® – Real Estate Brokerage as a REALTOR® and Utopia Mortgage LLC as a Mortgage Loan Originator! My designations and certifications reflect my dedication to helping you achieve your real estate goals in Blue Ridge, TX and other locations in the vibrant Dallas-Fort Worth area!
My commitment to ongoing professional development means I’m always enhancing my skills to serve you better. You can count on me as your trusted expert throughout your real estate journey. Plus, I’m fluent in English, Ukrainian, and Russian and ready to assist you every step of the way!
It’s All About You and Your Real Estate Dreams!
My mission is to serve you! With my knowledge and expertise, I’m here to help you achieve all your real estate goals and turn your dreams into reality!
I’m passionate about helping buyers and sellers navigate the exciting real estate landscape in Blue Ridge, Texas! Whether you’re searching for your dream home, exploring land options, or looking for commercial properties, my Real Estate Services have you covered.
Contact me today for all your real estate needs in Blue Ridge, Texas! Call/text 214-940-8149
Discover Yearly Real Estate Market Trends for Blue Ridge, TX
2003-2010
Blue Ridge, TX Real Estate Market in 2003
Blue Ridge, TX Real Estate Market in 2004
Blue Ridge, TX Real Estate Market in 2005
Blue Ridge, TX Real Estate Market in 2006
Blue Ridge, TX Real Estate Market in 2007
Blue Ridge, TX Real Estate Market in 2008
2011-2020
Blue Ridge, TX Real Estate Market in 2011
Blue Ridge, TX Real Estate Market in 2012
Blue Ridge, TX Real Estate Market in 2013
Blue Ridge, TX Real Estate Market in 2014
Blue Ridge, TX Real Estate Market in 2015
Blue Ridge, TX Real Estate Market in 2016
Blue Ridge, TX Real Estate Market in 2017
Blue Ridge, TX Real Estate Market in 2018
This market analysis is intended solely for educational purposes. This market analysis is based on data sourced from NTREIS, Inc. This analysis is exclusively focused on single-family homes and does not account for other property types. The total number of real estate transactions within the specified period and location may vary. Data accuracy cannot be guaranteed due to potential input errors made by NTREIS users. This market analysis does not account for all new construction home sales. If you need detailed information about recorded property sales or other public records, please contact the appropriate city or county office.