

The Secret Weapon for Dallas-Fort Worth Homebuyers And Sellers: A RENE-Certified Realtor. What Is RENE, and Why Should You Care?
Are You Leaving Money on the Table?
What Every DFW Homebuyer & Seller Must Know Before Hiring a Realtor
Buying or selling a home in Dallas-Fort Worth can feel like you stepped onto a football field for the first time. You have a clear goal, but the rules are complicated, and the other team wants to win too.
When you choose to buy or sell a home, you are making one of the largest financial decisions of your life. It is not just about finding a beautiful house or putting a FOR SALE sign in the yard; it is about securing the best deal possible and protecting your interests throughout the process.
In such a competitive market as Dallas-Fort Worth, how can you improve your chances of success?
The answer lies in partnering with a RENE-certified Realtor who brings specialized training and expertise to the table.
This article explains what RENE is, who benefits from working with a RENE-certified professional, and why RENE certification (credential) is essential for achieving your goals in the Dallas-Fort Worth real estate market, whether you are a buyer or a seller.
Key Takeaways
- RENE stands for Real Estate Negotiation Expert, a certification for Realtors who complete special training in negotiation.
- It equips an agent with advanced skills to negotiate better prices and terms for both homebuyers and sellers.
- Working with a RENE-certified agent in the competitive Dallas-Fort Worth market gives you a significant advantage.
- Paired with other certifications, RENE equips your agent with proven strategies to protect your interests.
What is the RENE Certification?
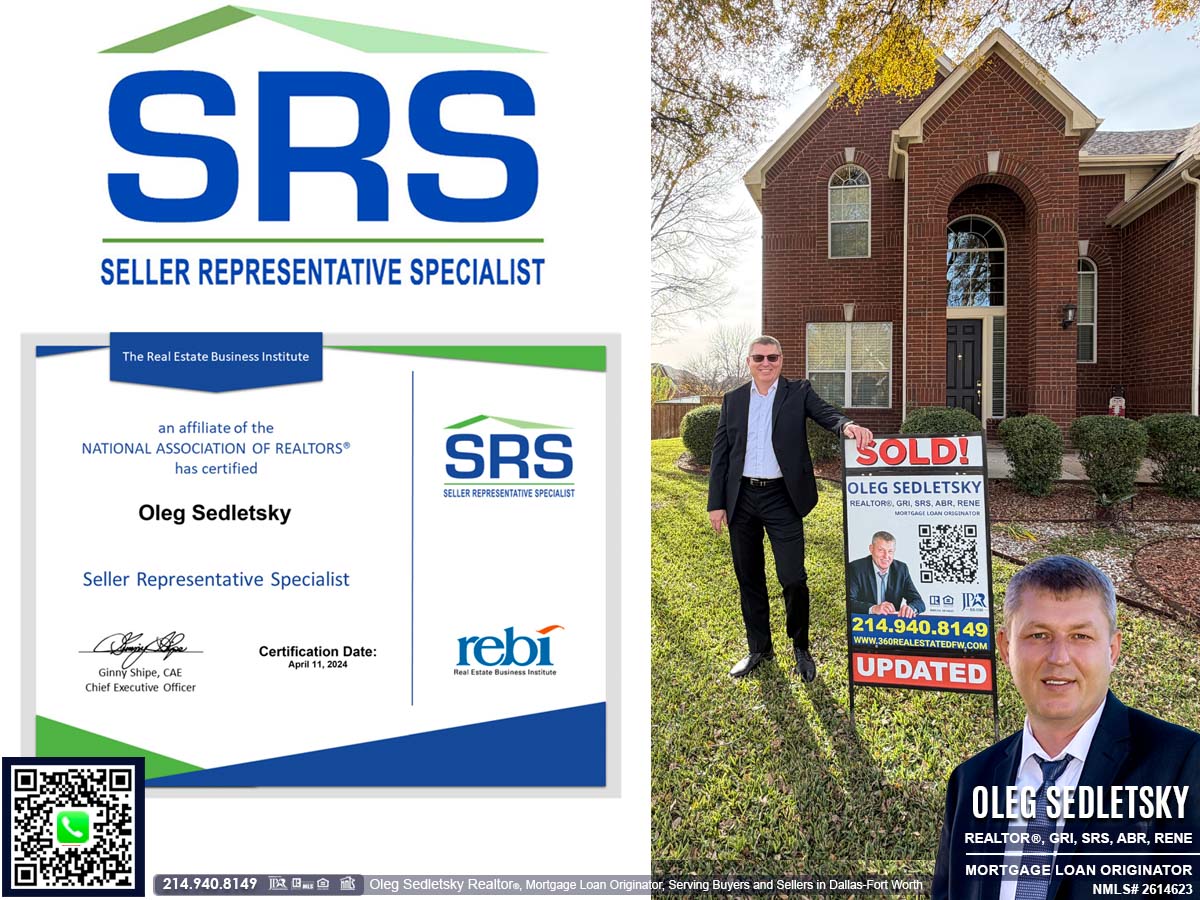
The Real Estate Negotiation Expert (RENE) certification is an official credential from the National Association of REALTORS® (NAR) and is offered through their affiliate, the Real Estate Business Institute (REBI).
This certification is designed for real estate professionals who aim to become master negotiators for their clients.
A RENE certification signifies that the agent has learned more than just making offers and counteroffers. They understand the psychology of negotiations, know how to craft creative solutions, and can advocate effectively for their clients to achieve the best possible outcome. Whether you are buying a home at the lowest price or selling your home at the highest, a RENE-certified agent has the expertise to help you succeed.

How is RENE Different from General Experience?
Experience is valuable, there is no doubt about it. An agent who has been in the business for years has seen a lot. However, RENE training adds a structured, strategic layer on top of that experience. It is the difference between a cook who follows a family recipe and a chef who went to culinary school. The family cook might make a great dish, but the trained chef understands the science behind the ingredients and can adapt to any situation.
The RENE certification dives deep into the psychology of negotiation, specific tactics, and proven strategies. While other designations focus on representing buyers or sellers in general, RENE is all about the art of the deal itself. It turns good instincts into a reliable, repeatable process for success.
How Does a RENE-certified Agent Help Homebuyers?
If you are looking to buy a home in Dallas-Fort Worth, a RENE-certified agent is a powerful ally. Let me show you what I, as a RENE-certified Realtor in DFW, can bring to the table for homebuyers.
My goal is not just to find you a house but to negotiate the best possible price and terms. This could include securing a lower purchase price, getting the seller to help with closing costs, negotiating repairs identified during the home inspection, or arranging favorable contingency timelines that protect you. I am trained to understand the seller’s motivations and craft an offer that is both appealing to them and highly advantageous for you.
How Does a RENE-certified Agent Help Home Sellers?
For home sellers, partnering with a skilled negotiator like a RENE-Certified Realtor is key to maximizing profits.
When selling your home, you want the best price with minimal hassle. My RENE training enables me to expertly manage offers.
I specialize in creating competitive situations that drive up the sale price. I also navigate repair or credit requests with care, ensuring your financial interests are protected. My goal is to help you close the deal with more money in your pocket and less stress along the way.

What “Superpowers” Does a RENE Agent Have?
During my training for RENE certification, I picked up tools like:
- Reading between the lines when an offer comes in
- Knowing how to handle multiple bids (which happens a lot in North Texas)
- Keeping my cool when the other side gets heated or tries to play tough
- Figuring out what the other person really wants
- Using timing and creative solutions to move things forward, not just hoping everything works out
I also learned specific strategy names like BATNA, WATNA, and ZOPA, but you will not hear me use fancy words at the kitchen table, I use this knowledge to help you get the best deal. Think of it as bringing an umbrella before it rains. My job is to keep you dry.

How Can a Realtor with RENE certification Help When the Market Gets Tough?
Dallas-Fort Worth moves fast. That means sometimes you bump into picky buyers, stubborn sellers, or three offers on the table at the same time. RENE certification taught me the art of staying calm during a stormy conversation, working with everyone’s motivations, and making sure no one gets left out in the cold. With this training, I can turn pushy negotiations into teamwork, whether you are buying or selling a home.
Will a Realtor with RENE certification get your house sold faster or for more money?
Yes. A RENE-certified Realtor will help you secure the best possible deal. Their skilled negotiation can get your home off the market sooner, attract serious buyers, and lead to better offers.
Will a Realtor with RENE certification help you buy a home for less?
Yes. A RENE-certified Realtor will help you achieve the best possible deal. Smart negotiation can help you purchase the home you want at a price and terms that meet your needs.
How Does RENE Pair With Other Certifications?
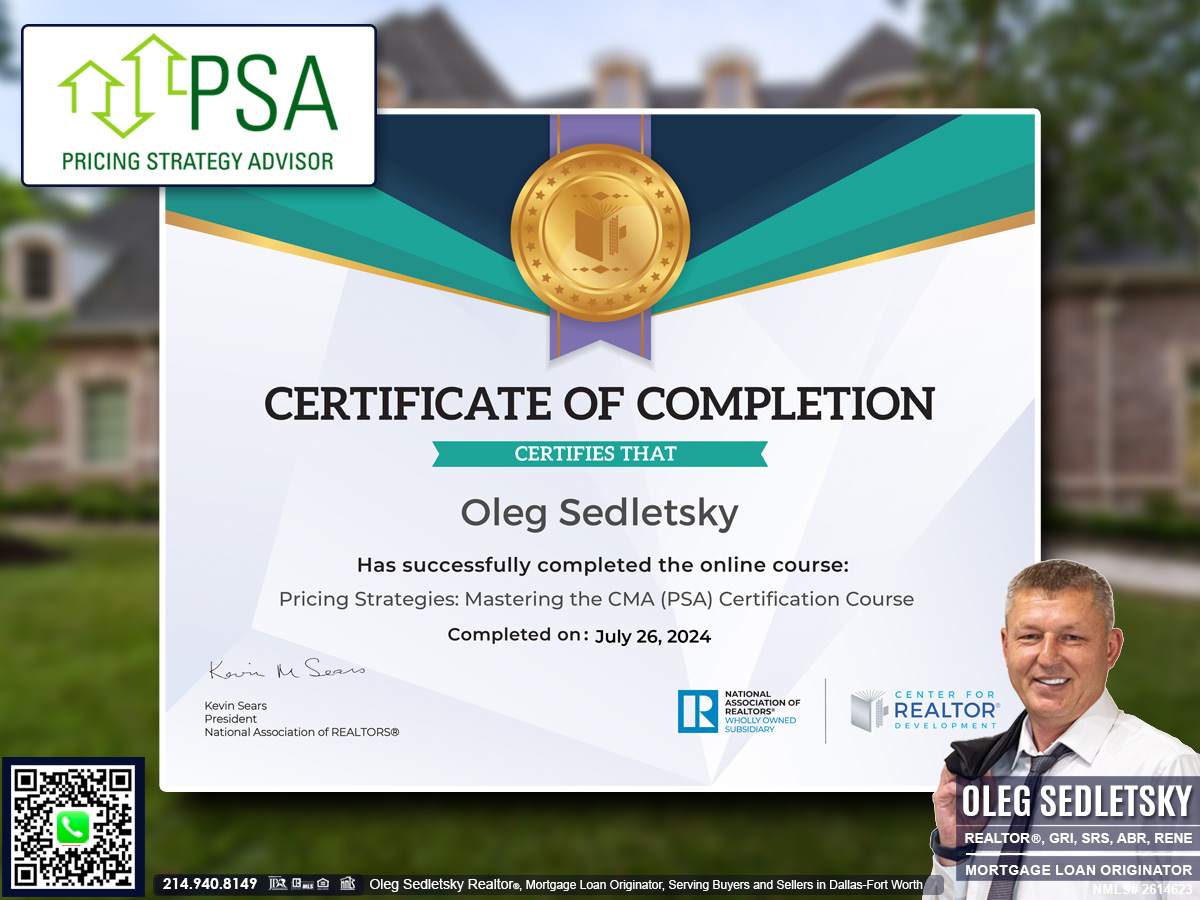
I combine my RENE certification with my Pricing Strategy Advisor credential. Think of it as baking: PSA means I know the right amount of each ingredient (how to price your home right), while RENE means I handle turning up the heat (negotiating offers) so the deal turns out just right.
Real Estate Designations and Certifications: Why I Chose to Earn Them (and Why It Matters for You)
What makes someone an “expert” anyway? I’ve always believed you deserve someone who keeps learning. That’s why I didn’t just stop at “agent.” I earned five certifications (look for GRI, SRS, ABR, PSA, and, yes, RENE). In addition, I became a Texas Mortgage Loan Originator.
Think about it. Would you trust a surgeon who does the bare minimum, or one who masters every tool and technique? The same applies in real estate.
The GRI designation shows I’ve mastered the essential rules, laws, and best practices, ensuring no detail is overlooked. The SRS and ABR designations give me a strategic edge by helping me understand both sellers’ tactics and buyers’ goals. My PSA certification allows me to price homes with precision, ensuring we attract the best offers. RENE certification prepares me to negotiate confidently and protect your interests, even in high-pressure situations.
When it comes to financing, being a Mortgage Loan Originator truly makes a difference. If you are a seller, I double-check every buyer to ensure you are not left waiting for financing that falls through. If you are a buyer, I provide access to a wide variety of mortgage products to help you secure financing.
One more thing: I never stop learning. Real estate is a complex and dynamic field, and I’m committed to staying ahead so I can serve my clients better and protect their best interests.
When you work with me, you get a complete set of tools and strategies. Every certification and designation I earn is another tool in my arsenal, crafted to open doors and create opportunities for you.

Ready for Your Own Success Story?
Imagine walking away from your home sale or purchase, confident you achieved the best possible outcome. Would you prefer to rely on luck or have a skilled negotiation expert by your side every step of the way?
If you’re planning a move, don’t settle for less. Put my expertise to work for you. Contact me today!
Unlock Exceptional Service: Get in Touch with Me Today
Assistance with all your real estate needs in the Dallas-Fort Worth area is just a click or call away. Reach out at 214-940-8149 or connect through the links below.

The Price Factor and PSA Difference: Data Over Drama in DFW Real Estate. What is PSA and Why It Matters for Homebuyers and Sellers
Data Over Drama: The Importance of the Correct Property Price in Dallas-Fort Worth Real Estate
Setting the right price for a home in Dallas-Fort Worth is one of the most critical steps whether you plan to buy a home or sell a home. For home sellers, pricing it too high means your property could sit on the market, collecting dust while more accurately priced homes sell. Price it too low, and you risk leaving thousands of your hard earned dollars behind. For homebuyers, making an offer that is too low might get ignored, while offering too much means you overpay.
This is where a special skill comes into play, one backed by a certification called PSA. As a Realtor serving the vibrant Dallas-Fort Worth area, I often get asked what all the letters after an agent’s name mean. Today, I want to pull back the curtain on one of the most important ones for your bottom line: the PSA certification. Understanding what it is and why it matters can give you a significant advantage.
Key Takeaways
PSA stands for Pricing Strategy Advisor. It is a certification earned by a Realtor who has completed specialized training from the National Association of REALTORS® on how to price properties accurately.
It’s all about the data. A PSA certified agent uses in-depth market analysis, not guesswork, to determine a home’s value. This helps home sellers set competitive list prices and helps homebuyers make smart offers.
PSA certification benefits both buyers and sellers. It provides home sellers with a solid strategy to attract qualified buyers and provides homebuyers with the confidence to avoid overpaying.
A PSA is a specialist. While a standard real estate license is a general requirement, the PSA certification is like an advanced degree specifically in property valuation and pricing strategy.

The Delicate Balance of Home Pricing
Setting the right price for a home is a delicate balance between a homeowner’s personal goals and the realities of the current market. While sellers naturally have an ideal figure in mind, this must be aligned with objective, real-time data to attract serious buyers.
Determining a home’s price depends on much more than overall trends or recent sales. Important factors such as location, property condition, lot size and floorplan, potential for different uses, Home owners association guidelines, city or municipal regulations, and many other factors each play a critical role in shaping the final price.
Because these elements interact in complex ways and can change over time, support from a skilled real estate professional is invaluable. This is why having a realtor with PSA certification on your side is so important when selling a home in the Dallas-Fort Worth area.
The right price matters just as much to buyers. Accurate pricing gives homebuyers confidence that they’re making a smart investment for their present and future.
Partnering with a PSA-certified Realtor offers a distinct advantage to homebuyers as well.
What is a PSA?
PSA stands for Pricing Strategy Advisor. It is a certification earned by a Realtor who has completed specialized training from the National Association of REALTORS® on how to price properties accurately.
The PSA certification proves that your Realtor has invested time and effort to master the art and science of determining a home’s most accurate market value.
Think of a Realtor with a PSA certification as a property pricing specialist. The National Association of REALTORS® created this certification to equip agents with advanced skills in a critical area: pricing homes. This isn’t just about pulling up a few nearby sales. The training goes much deeper.
A PSA certified agent learns how to build a powerful Comparative Market Analysis, or CMA. This is the document that compares your property to similar ones that have recently sold. It’s like a financial health report for a house. An agent with this training knows how to select the best comparable properties and, just as importantly, how to make adjustments. Is the kitchen in the home you want to buy newly remodeled while the one down the street is dated? A Realtor with a PSA certification knows how to assign a value to that difference.
How is a PSA Certification Different from Other Designations and Certifications?
The world of real estate has many Designations and Certifications, each with a different focus. Let’s use an analogy. Think of doctors. You have a general practitioner who knows a lot about overall health. Then you have specialists, like a cardiologist who focuses only on the heart.
A standard real estate license is like the general medical degree. Other common Designations, like the Accredited Buyer’s Representative (ABR) or Seller Representative Specialist (SRS), are specialties in representing buyers or sellers. The PSA certification is another layer of specialization, focusing entirely on the “heart” of every transaction: the price. It’s a deep dive into valuation that complements all other real estate knowledge, making an agent a more well rounded professional.
Why PSA Matters for Dallas-Fort Worth Home Sellers
As one of the most active real estate markets in the country, Dallas-Fort Worth moves quickly. As a home seller, your biggest challenge is capturing the attention of serious homebuyers right away. The key is pricing your home correctly from day one.
A Realtor with a PSA certification helps you do just that. They move beyond emotion and guesswork to provide you with a data backed pricing strategy. This allows you to enter the market with a price that is both competitive enough to attract immediate interest and high enough to maximize your return. A well priced home often sells faster and for a better price than one that has to go through multiple price reductions.
How a PSA Helps Dallas-Fort Worth Homebuyers
The benefits are just as significant for those looking to buy a home. The Dallas-Fort Worth market can be competitive, and it’s easy to get caught up in a bidding war or fall in love with a home that is priced above its true value.
A Realtor with a PSA certification helps protect you from overpaying. They can analyze the asking price of a property and show you exactly how it stacks up against the market data. This gives you the power to make a confident and fair offer. Furthermore, if an appraisal comes in with a different value, an agent with PSA training is better equipped to analyze the appraiser’s report and negotiate on your behalf, potentially saving you from a deal falling apart.
What is better than PSA certification?
The PSA certification is definitely great for both homebuyers and home sellers. But if your agent took the time and effort to earn even more real estate designations and certifications, that’s even better! Each additional certification shows a commitment to professional growth and better results for clients. You want someone in your corner who understands every side of the process—not just pricing, but negotiations, working with buyers, representing sellers, helping during tough transactions, and even understanding mortgages. Choosing a Realtor who has invested in several designations means you get more well-rounded expertise on your side.
Real Estate Designations and Certifications: Why I Chose to Earn Five (and Why It Matters for You)
I believe that learning never stops, especially when it comes to helping my clients buy or sell a home in Dallas-Fort Worth. That’s why, after earning my real estate license, I set my sights higher. I wanted to serve you better, so I earned five designations and certifications: GRI, SRS, ABR, PSA, SFR, and RENE. On top of that, I’m also a licensed Texas Mortgage Loan Originator.
Here’s what this means for you: My SRS designation shows my commitment to helping home sellers get the best results, while my ABR training taught me the strategies and negotiation tactics buyers use. When I represent you as a seller, I know exactly what to expect from buyers and how to respond. My PSA certification is what helps me determine the most accurate price for your property, taking the guesswork out of pricing. My Real Estate Negotiation Expert (RENE) certification means when it’s time to negotiate, you have someone in your corner who’s ready for anything. And as a Mortgage Loan Originator, I can review a buyer’s financial strength, so you know we’re considering only serious and qualified offers.
When you work with me, you get all of this experience and knowledge working directly for you. Every designation I’ve earned is designed to give my clients better advice, stronger protection, and more successful deals.
Your Next Step to a Smarter Move
Choosing a Realtor is a major decision. The agent you select can have a huge impact on your financial outcome and your stress level. While experience and personality are important, an agent’s certifications tell you something deeper about their commitment to their craft. They show that an agent has gone above and beyond the basic requirements to become a true expert.
In a market as complex as Dallas-Fort Worth, having an expert guide you through the pricing process is invaluable. A Realtor with a PSA certification brings a higher level of knowledge to the table, ensuring you are positioned for success whether you are a home seller or a homebuyer.
Are you ready to begin your home buying process with an expert who understands every angle? Contact me today for all your real estate needs in DFW.
Unlock Exceptional Service: Get in Touch with Me Today
Assistance with all your real estate needs in the Dallas-Fort Worth area is just a click or call away. Reach out at 214-940-8149 or connect through the links below.

Dallas-Fort Worth Real Estate: What Is a GRI? Who Can Benefit From It? And Why It Matters?
Navigating North Texas Real Estate: What’s with All Those Letters After a REALTOR®’s Name?
When you scroll through listings or meet agents at open houses, you might notice a string of letters after their names. It looks like alphabet soup.
You see things like GRI and wonder if it actually means anything for you.
Buying a home or deciding to sell a home in Dallas-Fort Worth is a huge financial move. You want someone on your side who knows more than just how to unlock a door. That is where the GRI comes in.
This post explains exactly what those three letters mean, why they matter for you, and how they can save you time and money in our local market.
Key Takeaways
- The Gold Standard in Real Estate
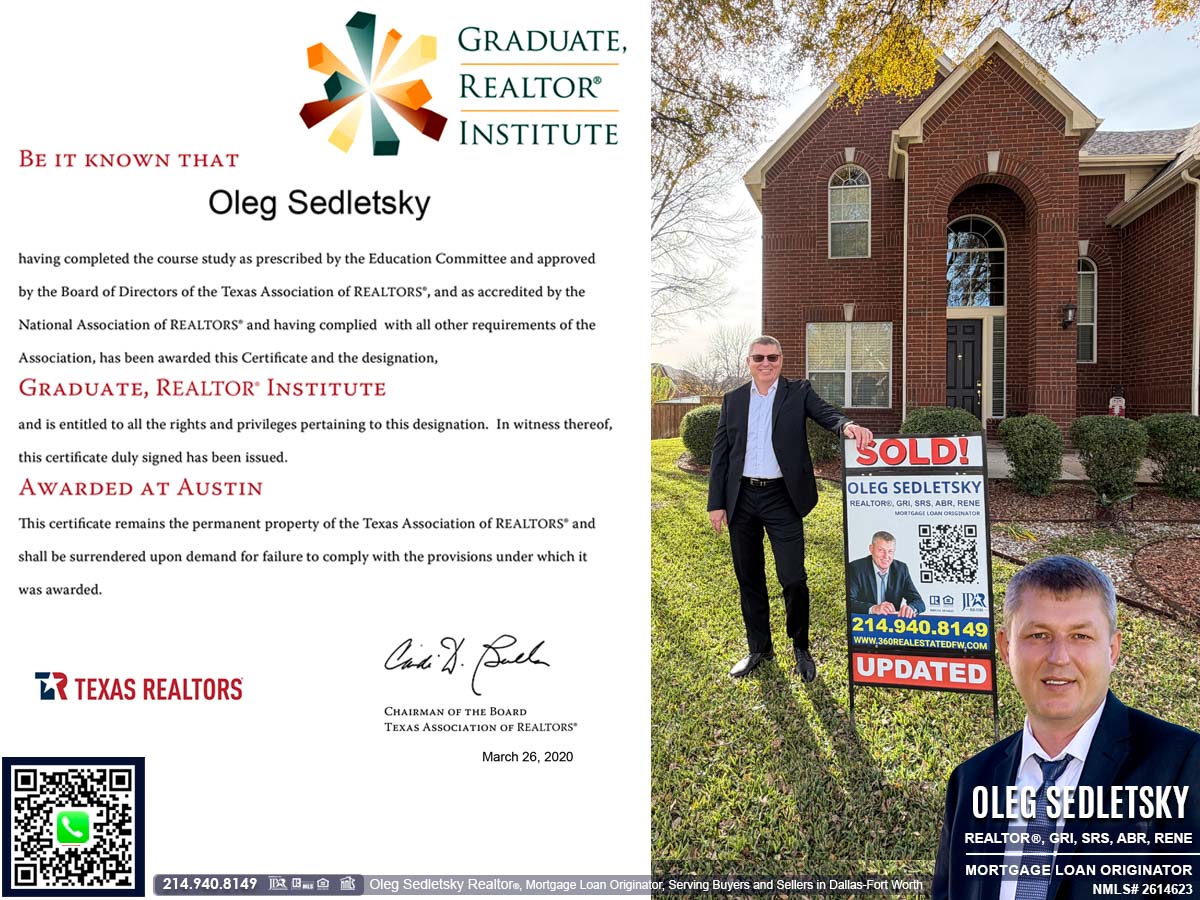
GRI stands for Graduate, REALTOR® Institute. It is a nationally recognized designation that sets the bar for excellence in the real estate industry. - A Serious Commitment to Excellence
Earning the GRI designation requires about 90 hours of advanced education, going far beyond the basics of standard licensing. - Local Expertise That Matters
GRI agents dive deep into real estate fundamentals, mastering contracts, negotiations, Texas-specific laws, ethics, and market trends. This knowledge is especially valuable in the dynamic North Texas market.
What Does GRI Mean, Exactly?
Pretend you’re picking a pilot for your important flight. You could have the regular pilot—she’s got her license and knows the basics. Or you could get a pilot who’s been through extra training for handling storms, tricky runways, and even the backup systems. GRI is that second pilot.
The GRI is a designation awarded to Realtors, standing for Graduate, REALTOR® Institute.
It is a rigorous program offered by the National Association of REALTORS®. In Texas, this designation is often called the “gold standard” for foundational expertise.
To get it, a Realtor must complete in depth education that goes way beyond the basic requirements to get a license. We are talking about roughly 90 hours of coursework covering everything from complex contracts to advanced marketing.
It shows that an agent has taken the time to master the technical and practical skills needed to navigate the real estate world effectively.
Why Does the GRI Matter for You?
You might be thinking, ‘That extra education is great for the agent, but how does it actually benefit me?’
Imagine you are hiring a guide for a safari. You could hire someone who just read the brochure, or you could hire someone who has studied the terrain, knows the animal migration patterns, and understands safety protocols inside and out.
In the wild real estate market of Dallas-Fort Worth, a Realtor with GRI designation is that expert guide.
Here is why that matters.
1. Mastering the Rules of the Road
Real estate involves a mountain of paperwork. A GRI agent dives deep into contracts, residential forms, and appraisals. This is huge because one small mistake on a contract can cost you thousands of dollars or even kill a deal.
For example, GRI courses cover Texas specific topics like the Seller’s Disclosure Notice and TREC contract forms. They learn about property conditions common in North Texas, such as foundation concerns or flood zones. Knowing these details upfront protects you from nasty surprises later.
2. Pricing Power
Pricing a home is not a guessing game. If you price it too high, it sits on the market and gets stale. Price it too low, and you leave money on the table.
GRI training includes specific modules on Comparative Market Analysis (CMA). This helps agents price homes realistically, which is critical in places like Collin County where inventory fluctuates. They know how to look at the data to position your home correctly from day one.
3. Ethics and Professionalism
The GRI curriculum places a heavy emphasis on the Code of Ethics. This might sound dry, but it is your safety net. It ensures your agent is operating with honesty and integrity. They are trained to put your interests above their own. When you hire a GRI agent, you are hiring a professional who treats their career seriously.

How GRI Helps in the Dallas-Fort Worth Market
Our market in North Texas is unique. We have booming suburbs like Princeton, Anna, Melissa, Celina, and Van Alstyne. We also have older established neighborhoods with different sets of challenges.
A GRI agent understands these local dynamics. They are often trained by local instructors who know the DFW market. This means they understand regional buyer preferences and growth areas.
For Home Sellers:
They use advanced marketing strategies to get your home seen by the right people. They know how to handle multiple offers and negotiate repairs without losing the buyer.
For Homebuyers:
They can spot potential issues with a property before you make an offer. They understand lending essentials and can guide you through the financing maze.
Real Estate Designations and Certifications: My Take on Why It Matters
I believe homebuyers and home sellers deserve a realtor who always wants to know more, do more, and help more.
Some agents stop at a license, but I chose to go further because I want to win for my clients, every time. Besides GRI, I also earned SRS, ABR, PSA, SFR, and RENE designations and certifications.
On top of that, I am also a licensed Texas Mortgage Loan Originator.
This combination of expertise is a direct benefit to you. I understand the entire real estate and financing process from every angle.
Think of it like a football game. My Accredited Buyer’s Representative (ABR) training taught me the playbook that buyers use. Because I know what plays they are likely to run, I can defend against them effectively when I represent you as the seller.
My mortgage license allows me to analyze a buyer’s financial strength instantly. I can tell if an offer is solid or if it is built on shaky ground. This ensures we only consider serious, qualified offers, saving you from wasting time on deals that will fall through.
When we team up, you get the full advantage of my extensive knowledge. I use every tool in my belt to get you the best possible outcome.
Next time you see ‘GRI’ next to a name…
In a fast moving market like Dallas-Fort Worth, you need every advantage you can get. An agent with the GRI designation brings a higher level of knowledge and professionalism to the table. It reduces your risk, lowers your stress, and increases your chances of a smooth transaction.
So the next time you see “GRI” next to a name, you will know exactly what it means. It means you are in good hands.
If you are ready to make a move in North Texas and want an expert guide by your side, reach out today. I am here to help you navigate the process with confidence.
Unlock Exceptional Service: Get in Touch with Me Today
Assistance with all your real estate needs in the Dallas-Fort Worth area is just a click or call away. Reach out at 214-940-8149 or connect through the links below.

What on Earth Does ABR Mean? How Can It Benefit Homebuyers in Dallas-Fort Worth?
Buying a home is a big deal. For most people, it represents the largest financial decision they will ever make. Imagine you are about to climb a huge mountain. You would not just start walking uphill, would you? You would hire an expert guide, someone who knows every path, every hidden danger, and the surest way to the top.
Finding a home in the Dallas Fort Worth area can feel like that climb. The stakes are high, the process can be tricky, and the choices you make will have a lasting impact. This is where the right guide makes all the difference.
You have probably seen some agents with letters like “ABR” after their names.
You might wonder what that alphabet soup means. Who is it for? Does it actually help you, or is it just fancy branding?
This post will break down exactly what an ABR is and why having an agent with this credential matters when you want to buy a home in North Texas.
Key Takeaways
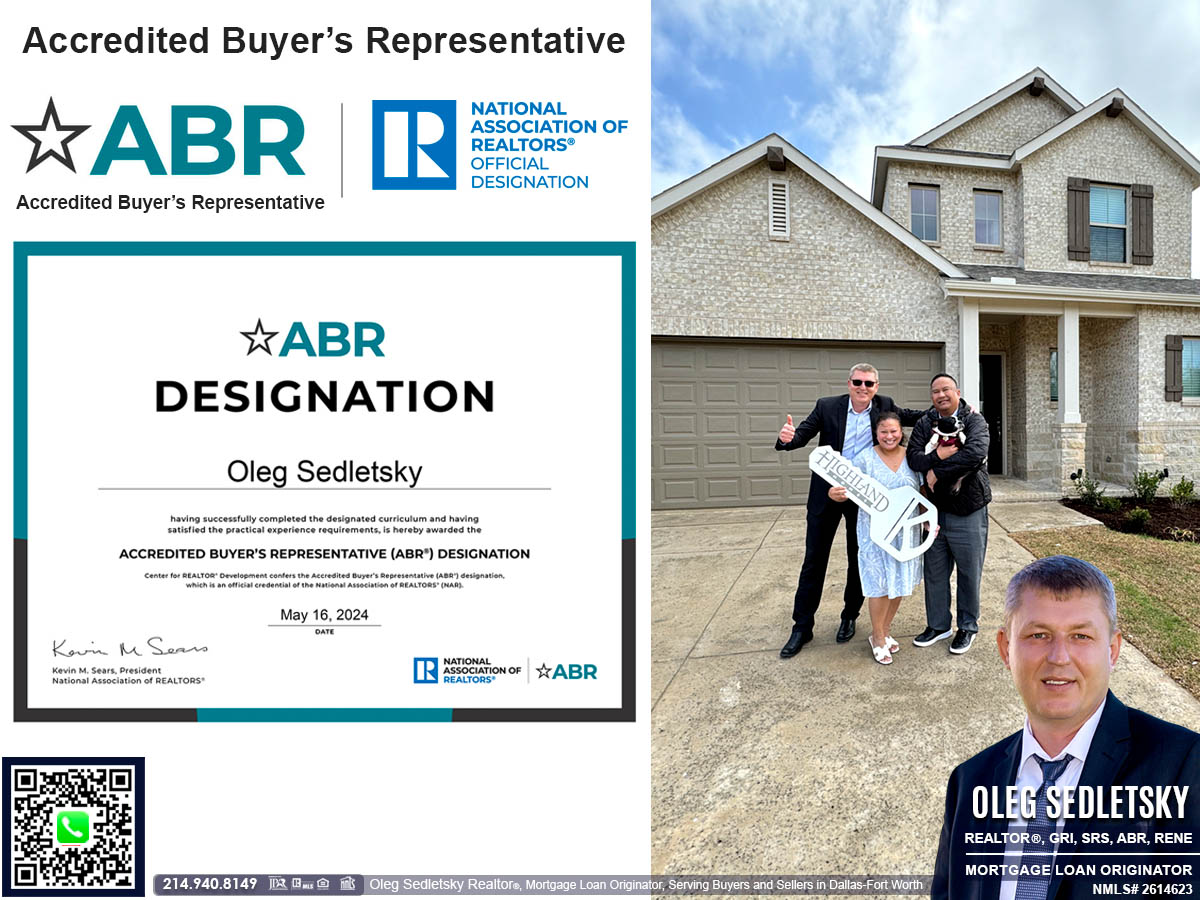
- ABR stands for Accredited Buyer’s Representative. It is a designation for real estate agents who have specialized training in representing the interests of homebuyers.
- These agents possess advanced skills. ABR designees have completed advanced training in key areas such as buyer-focused negotiation, client advocacy, and market analysis.
- It usually costs you nothing extra. You get an ABR expert guide without an extra fee.
What Does ABR Stand For and What Does It Mean?
The letters ABR stand for Accredited Buyer’s Representative. This is a designation awarded by the National Association of REALTORS®.
Think of it this way. A general practice doctor can help with many common health issues. But for a specific, complex problem, you would want to see a board certified specialist. That specialist has completed extra training and demonstrated deep knowledge in one particular area.
An agent with an ABR credential has done the same for the world of home buying. They have completed specialized training that is focused completely on representing you, the buyer. They have also proven their real world experience in handling transactions for buyers. It is more than just a title; it is a sign of proven expertise.

How is an ABR-designated agent different from a regular real estate agent?
You might be thinking, “Can’t any real estate agent help me buy a house?” The simple answer is yes. But there is a significant difference in the level of dedicated service.
An ABR-designated agent has gone beyond the basic state licensing requirements. To get a real estate license, agents learn the general laws and fundamentals of property transactions. An ABR-designated agent takes their education much further, studying topics like:
- Advanced negotiation strategies to get you the best price and terms.
- Detailed market analysis from a buyer’s point of view.
- In depth knowledge of financing options to help you navigate the money side.
While any licensed agent can unlock a door for you, an ABR-designated agent has formally committed to being a specialist in protecting and advocating for homebuyers.
What Kind of Training Does an Agent with ABR designation go through?
Earning those three letters is not a simple task. Agents must complete a comprehensive course, which is not a quick webinar. It involves classroom or online instruction that takes multiple days to finish.
The course covers subjects that are most important to you as a homebuyer:
- How to conduct an effective buyer consultation.
- Tactics for selecting the right property.
- How to write offers/contracts that protect your interests.
Beyond the coursework, they must also show practical experience. They need to prove they have successfully closed a minimum number of deals where they represented the buyer. They cannot just read about it; they have to do it.

Does Working With an ABR Agent Cost More Money?
This might be the best part: No.
Working with an ABR-designated agent does not typically cost you any more than working with a regular agent. The ABR designation is an investment the agent makes in their professional development. They pay for the classes and annual dues to keep their skills sharp. They do this to provide better service, not to add fees to your bill. You receive the benefit of a highly trained expert for the same price as a generalist.
How Does an ABR-designated Agent Specifically Help Me?
Imagine you are in a negotiation. Would you want your representative to be neutral, or would you want them to be 100 percent on your side?
An ABR-designated agent works exclusively for your interests. In real estate, situations can arise where one agent tries to represent both the buyer and the seller. An ABR-designated agent is trained to maintain clear loyalty to you.
They assist you by:
- Finding the right property: Pinpointing homes that genuinely match your needs and wants.
- Structuring offers wisely: Writing offers designed to protect you, not just to get a quick acceptance.
- Negotiating effectively: Advocating for the best possible price and terms on your behalf.
- Navigating challenges: Guiding you through inspection issues, financing questions, and other hurdles.
Will an ABR Agent Help Me Negotiate a Better Price?
Negotiation is a central focus of the ABR training. While no agent can guarantee a specific financial outcome, an ABR professional has a toolkit of strategies that many other agents may not possess.
They are trained in how to:
Structure offers in a competitive market like we often see in Dallas Fort Worth.
Negotiate for repairs after an inspection reveals problems.
Manage situations with multiple offers for the same house.
They act as your advocate, using their specialized training to support your financial interests.

How Do I Verify an Agent Has Their ABR?
It is always smart to verify credentials. You can confirm an agent’s ABR status by visiting the National Association of REALTORS® website, which maintains a directory of designees.
You can also ask the agent directly. A legitimate ABR holder will be proud of their achievement and will happily provide verification. It should also be displayed on their business cards and marketing materials. If you feel any hesitation from them, it could be a red flag.
Beyond the Basic License: My View on Real Estate Designations and Certifications
I believe in giving my clients every possible advantage. I hold the ABR (Accredited Buyer’s Representative) designation because I am committed to serving homebuyers at the highest possible standard.
But I did not stop there.
I believe that the more an agent knows, the more value they bring to you. That is why I have earned five different designations and certifications:
- GRI (Graduate, REALTOR® Institute),
- SRS (Seller Representative Specialist),
- PSA (Pricing Strategy Advisor),
- SFR (Short Sales and Foreclosure Resource),
- RENE (Real Estate Negotiation Expert).
On top of that, I am also a licensed Texas Mortgage Loan Originator. This unique combination means I understand the house and the loan that buys it. When we work together, you get advice that covers both the property and the financing. It is a level of advocacy that is hard to find.
Bringing It All Together
Buying a home in the Dallas Fort Worth area is a significant life event. It can be exciting, but it can also be very complex. The ABR designation is a clear sign that an agent has invested the time and effort to master the art of representing homebuyers. It shows they are serious about their profession and your success.
When you combine that specialized training with deep local market experience and mortgage expertise, you have a powerful partner on your team. You do not have to navigate the biggest purchase of your life on your own.
Are you ready to begin your home buying process with an expert who understands every angle? Contact me today for all your real estate needs in DFW.
Unlock Exceptional Service: Get in Touch with Me Today
Assistance with all your real estate needs in the Dallas-Fort Worth area is just a click or call away. Reach out at 214-940-8149 or connect through the links below.

What in the World Does the SRS Mean? Why It Matters if You’re Selling Your Home in Dallas-Fort Worth?
A Detail That Can Change the Way You Sell Your House in Dallas-Fort Worth
When you look at a real estate agent’s business card, you might see a bunch of letters after their name. It can look like alphabet soup. You might wonder if those letters even matter. If you want to sell your house in Dallas-Fort Worth, one set of letters matters a lot. Those letters are SRS.
It stands for Seller Representative Specialist.
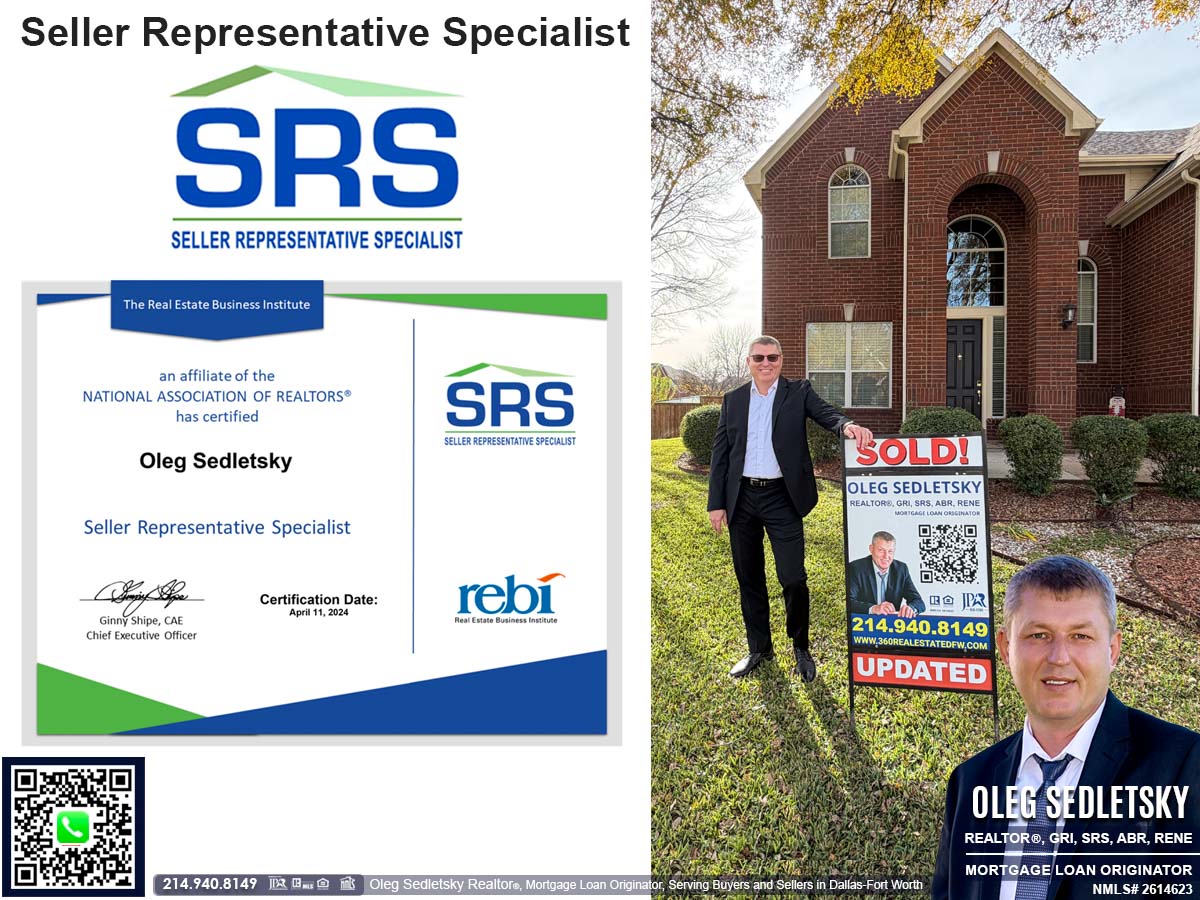
This is not just a fancy title. It means the agent with SRS designation has special training that can help you when you sell your home. It shows they have put in extra work to become an expert for home sellers just like you.
Key Takeaways
- Better Skills: An agent with the SRS designation has extra training to help home sellers.
- Special Training: They learn how to price homes, market them, and talk to buyers to get you the best deal.
- Local Expertise: In busy places like Dallas-Fort Worth, an agent with the SRS designation knows how to make your home stand out.
What Does the SRS Designation Mean for Home Sellers?
Think about it like this: your family doctor is great for checkups, but if you needed heart surgery, you would want a heart surgeon. Both are doctors, but the surgeon has spent extra time and effort learning everything about the heart.
In real estate, getting a license allows an agent to help people buy and sell property. The SRS designation is an addition. It is an extra credential that an agent must earn. It is given by the Real Estate Business Institute (REBI), which is the largest affiliate of the National Association of REALTORS®.
For sellers in North Texas, this means your agent chose to get more education. They learned advanced skills to advocate for you, especially in our busy DFW market. They know how to price your home accurately and market it with targeted online and offline promotions to attract the right buyers.
Why Pick an Agent with an SRS Designation in DFW?
Our local real estate market can be very competitive. In sought-after areas like Plano, Frisco, McKinney, Prosper, Celina, Allen, and other cities, many homes are for sale at any given time. It can be a challenge to get your property noticed.
An agent with the SRS designation is trained to make your house shine. They know how to build a strong case for your home’s value. They use high-engagement marketing to capture buyer attention. Whether handling multiple offers or figuring out a new strategy in a slower market, their goal is to help you sell your house successfully.
What Do Dallas Area Sellers Get from a Realtor with an SRS Designation?
When you hire someone with SRS, you get more than “just another Realtor.”
Personalized marketing: Think high-end photos, drone views, 3D tours, social media, and targeted promotions that click with DFW buyers.
Serious negotiation chops: Your agent won’t just take the first offer—they’ll work on getting you the best terms possible.
Peace of mind: From start to finish, they’re there to protect your interests, handle paperwork, keep everything above board, and help you skip the pitfalls.

Can the SRS Designation Help You Get a Better Price?
No agent can promise a specific price. But an agent with the SRS designation shows a deep commitment to seller expertise. The extra training teaches them how to study prices deeply. They learn tricks to talk to buyers and get better offers. They learn how to use marketing to show the best parts of your home. While it is not a 100% guarantee, this training often leads to better results for sellers in Dallas-Fort Worth.
Can an Agent with the SRS Designation Help with Buying Too?
Some people think a “Seller Representative Specialist” can only work with sellers, but that is not the case. Many agents in North Texas with the SRS designation also help people buy homes. In fact, it is a great benefit when they do. Think of it like a chess match. If you understand your opponent’s strategy, you have a better chance of winning. An agent who also represents buyers knows what they are looking for and what their common concerns are.
Personally, I didn’t stop with just SRS. I went on to earn the Accredited Buyer’s Representative (ABR) designation too. That means I understand what buyers want, what catches their eye, and what might make them hesitate. When you choose to work with me, you get the advantage of both worlds. I know what questions buyers are likely to ask and what concerns they might have, so I can address issues before they slow down your sale. Knowing both sides leads to better moves and stronger results, whether you’re hoping to sell your house or find the next one.
Why I Chose to Earn 5 Real Estate Designations and Certifications
I believe in continuous learning to better serve my clients. The SRS designation is proof of my dedication to sellers, but I did not stop there. I have earned five designations and certifications: GRI, SRS, ABR, PSA, SFR, and RENE.
On top of that, I am also a licensed Texas Mortgage Loan Originator.
This combination of expertise is a direct benefit to you. I understand the entire real estate and financing process from every angle. For example, my Accredited Buyer’s Representative (ABR) training taught me the negotiation tactics buyers use. Because I know what to expect, I can better counter those tactics when I represent you as the seller. My mortgage license allows me to analyze a buyer’s financial strength, ensuring we only consider serious, qualified offers. When we work together, you get the full advantage of my extensive knowledge.
A Message to Home Sellers in DFW
Selling a home is likely one of the biggest financial transactions of your life. You deserve an expert in your corner.
The SRS designation is a clear sign that an agent has invested in the skills needed to protect your interests and guide you to a successful sale.
If you want to discuss your property or have questions about the market, reach out. I am here to help you navigate the process with confidence.
Oleg Sedletsky,
Realtor® and Mortgage Loan Originator
Serving Dallas-Fort Worth

Unlock Exceptional Service: Get in Touch with Me Today
Assistance with all your real estate needs in the Dallas-Fort Worth area is just a click or call away. Reach out at 214-940-8149 or connect through the links below.

Dallas Home Show: A must-visit event to discover the best in home renovation and meet top contractors and remodelers. Over 100 photos
What Homebuyers, Homeowners, and Home Sellers Share
Greetings to all future and current homeowners, as well as home sellers!
As a Realtor®, Mortgage Loan Originator in Dallas-Fort Worth, and a homeowner myself, I’ve come to see one thing we all have in common: the home.
For homebuyers, the home is the starting point of a new future. For homeowners, it is a space of constant improvement. For home sellers, it is the finish line as they prepare for the next chapter by getting the home ready to list.
The truth is, every home will go through updates, renovations, maintenance, or repairs, depending on its owner. Whether you’re adding functionality, making repairs, upgrading to luxurious features, or renovating outdated materials, it will either be a DIY project or a job for a professional contractor.
When you decide to hire a professional rather than do it yourself, having a list of reliable contractors is a necessity. That’s why I’m always searching for great contractors and make it a priority to attend shows and expos. Here, I will share my experience from the Dallas Home Show held in January 2026. I will also talk about the value of having a contractor list, tips for finding the right contractor, and key things to look for at shows and expos.

Oleg Sedletsky Realtor®, Mortgage Loan Originator visiting the Dallas Home Show. | January 17, 2026
Key Takeaways
- A prepared list of vetted contractors is vital. Having vetted contractors ready prevents panic decisions during home emergencies.
- Face-to-face is better. Meeting professionals in person at an event like the Dallas Home Show allows you to gauge their communication and professionalism instantly.
- Efficiency matters. The Dallas Home Show gathers hundreds of local home improvement experts in one place, saving you time and effort.
- Renovations add value. Strategic updates like permanent lighting or kitchen improvements serve as powerful selling points.
Why You Should Always Have a Contractor List And Why a Contractor List is Your Most Valuable Asset
Let’s be honest, life happens. You never know when you’ll need a trusted contractor to tackle a project or repair.
Think of your home’s systems like the organs in a body. The plumbing, foundation, and electrical wiring keep the house alive. When one of these critical systems fails, you need a specialist immediately. You would not want to search for a doctor while in an ambulance, and you should not be searching for a plumber while water is flooding your kitchen.
When a pipe bursts or your AC gives out in the Texas summer, the situation is urgent. Scrambling to find someone online during a crisis often leads to hurried decisions, which can result in hiring someone unqualified or overpaying for the service.
You might ask, why would homebuyers need a contractor list if they haven’t bought a home yet? Here’s why. Sometimes, buyers find a home that needs a little love and care. By getting estimates from contractors, they can better understand the costs involved, which can be a game-changer when it comes to negotiating.
This is why having a plan is so important. I always advise my clients to follow the “Three P” approach: thorough Planning, meticulous Preparation, and Partnering with knowledgeable professionals. This strategy helps you make smart, confident decisions, even when you’re under pressure.

How to Find the Right Professionals
So, where do you find these trusted partners for your home? There are a few reliable methods.
- Online Search: You can browse the internet, but it is often difficult to separate glossy marketing from actual quality.
- Family and Friends: Asking people you trust is a great way to get honest feedback about their experiences.
- Your Realtor: This is often your best resource. As real estate professionals, we constantly interact with contractors and see the results of their work firsthand. We know who shows up on time and who delivers quality.
- Shows and Expos: Attending events where businesses present their services gives you a unique advantage.
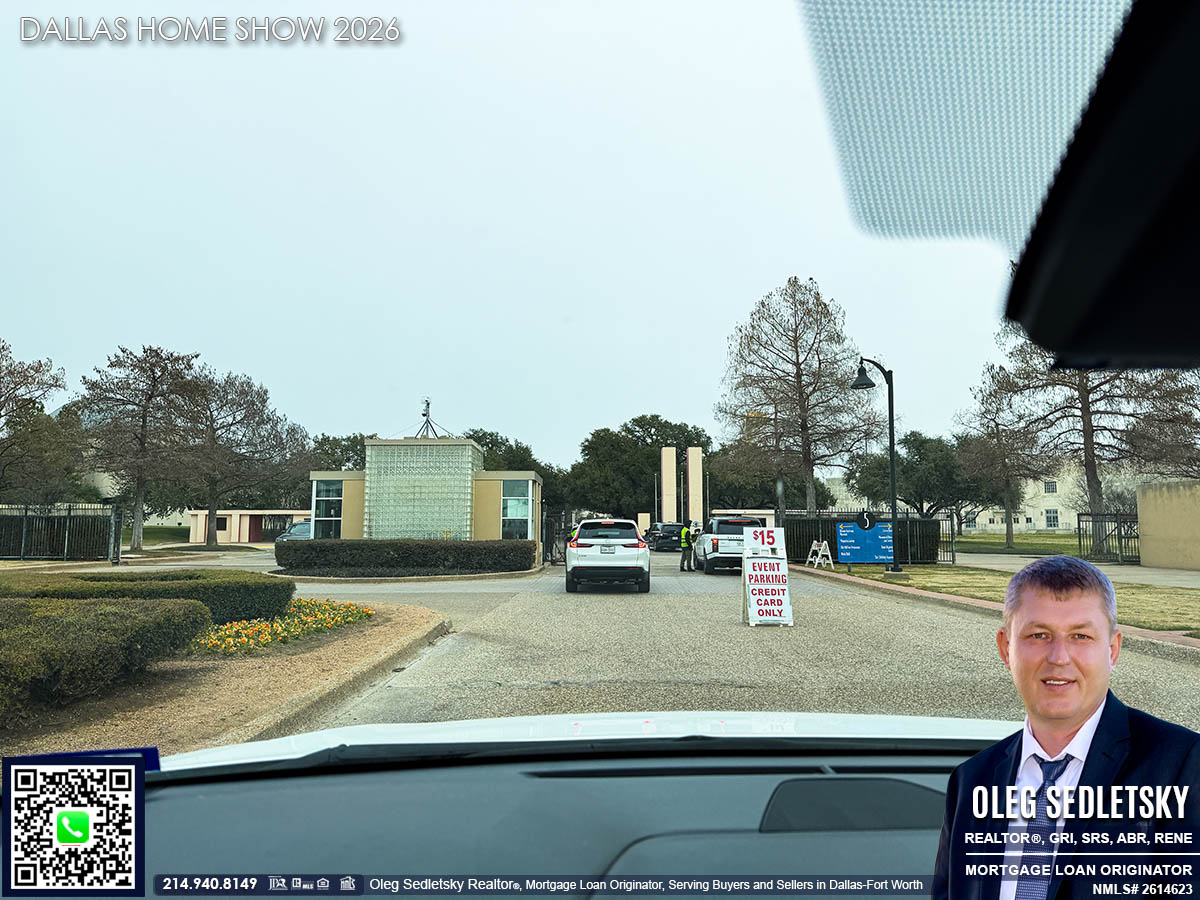
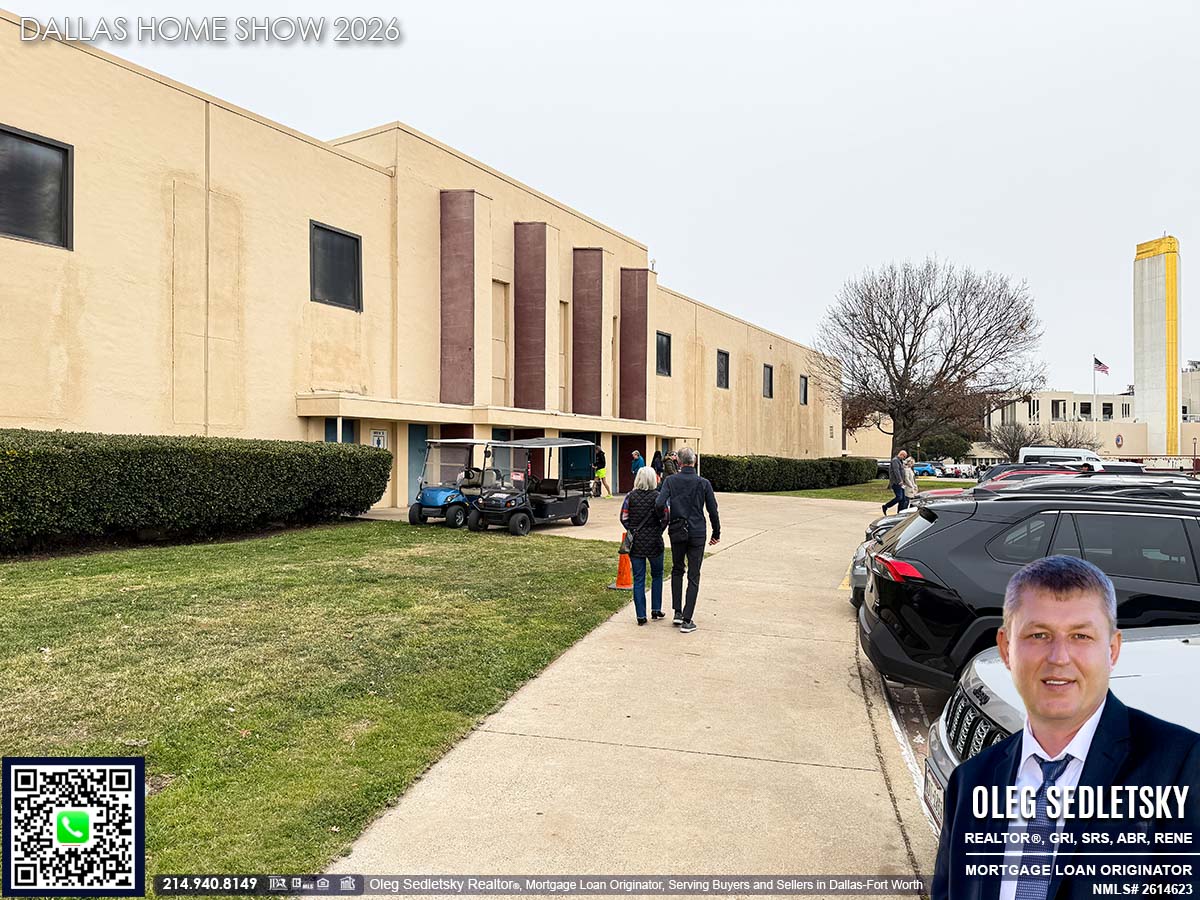
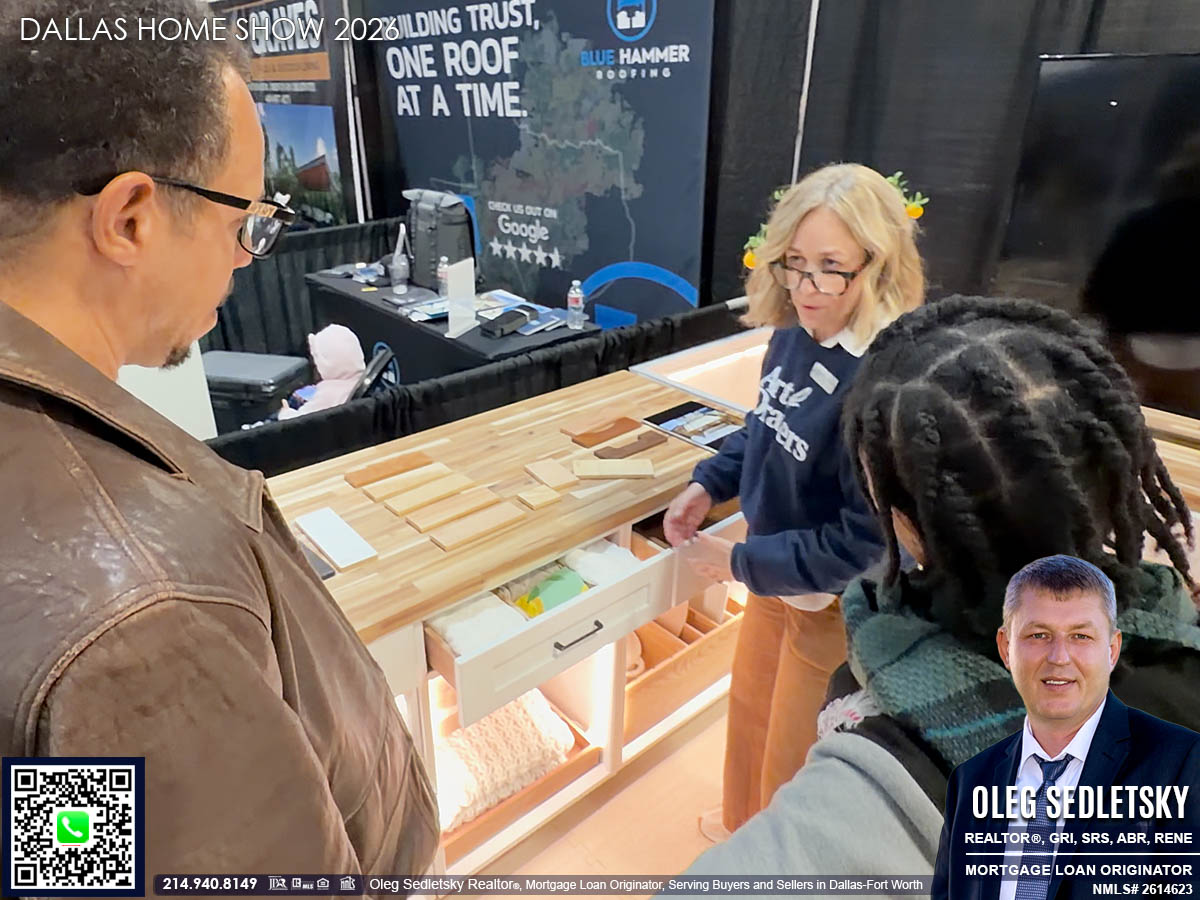
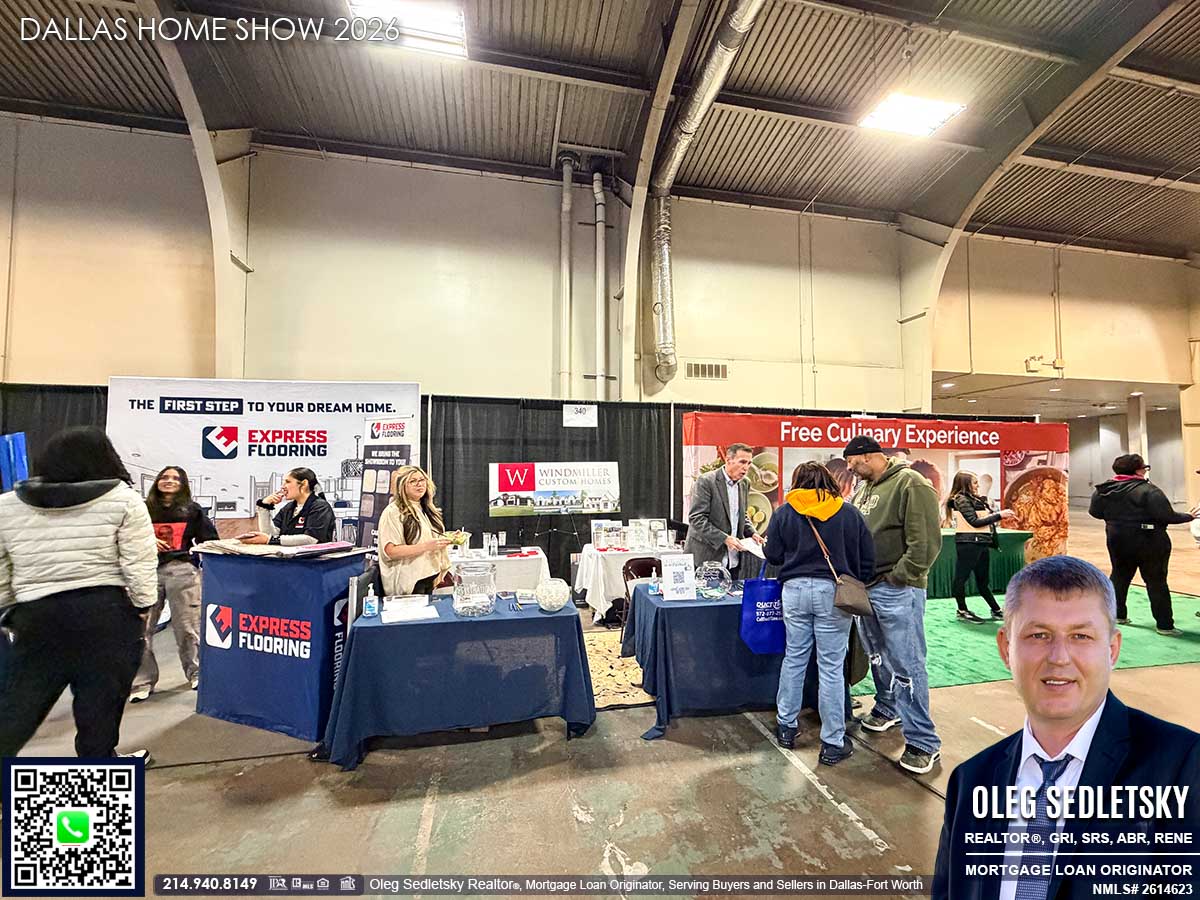
My Experience at the Dallas Home Show
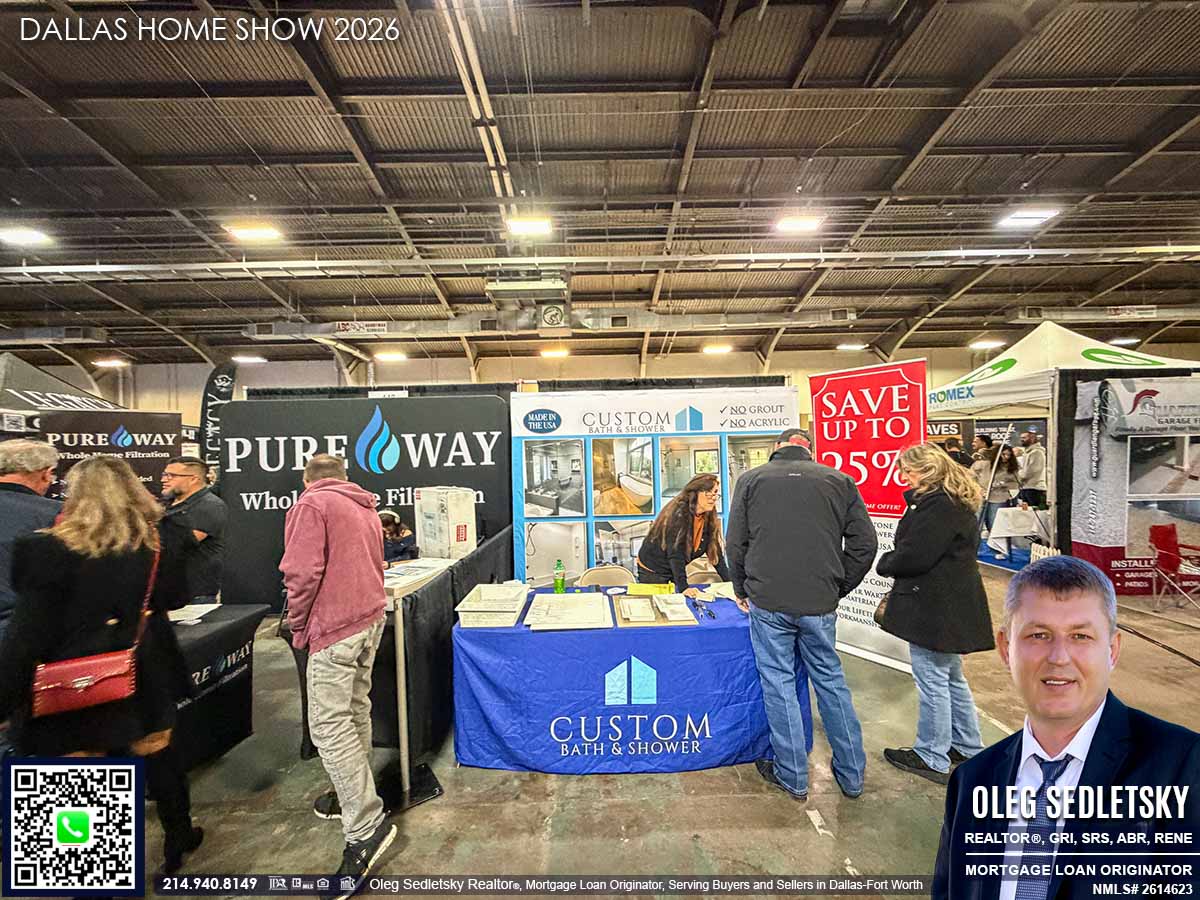
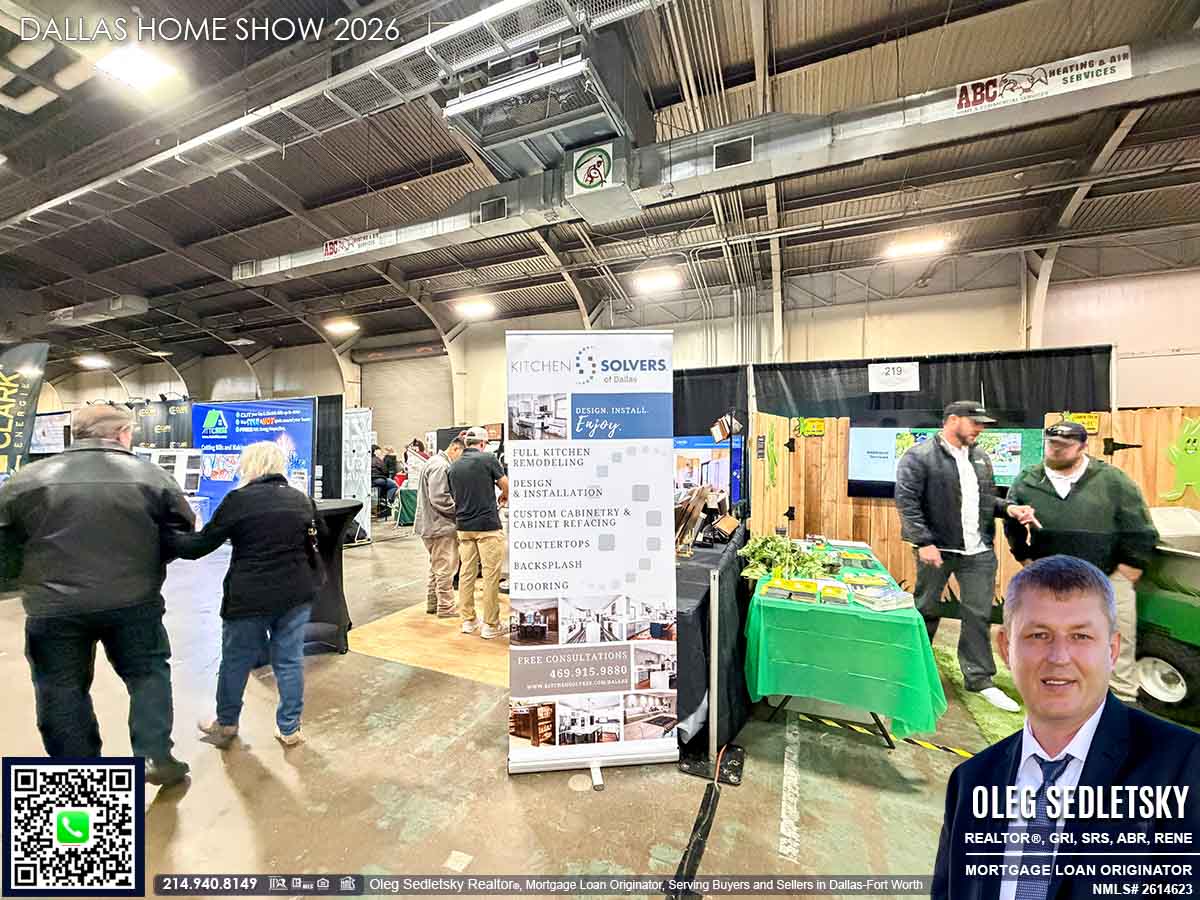
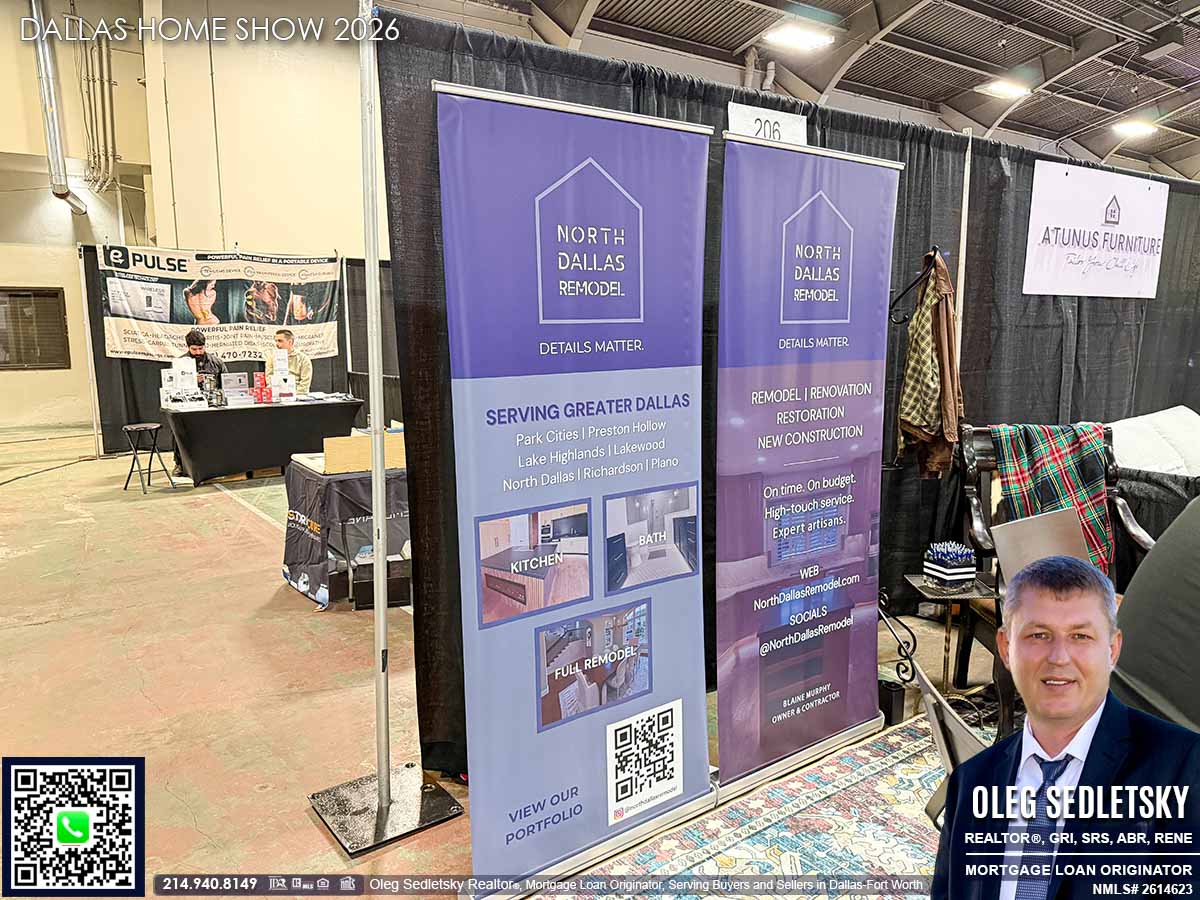
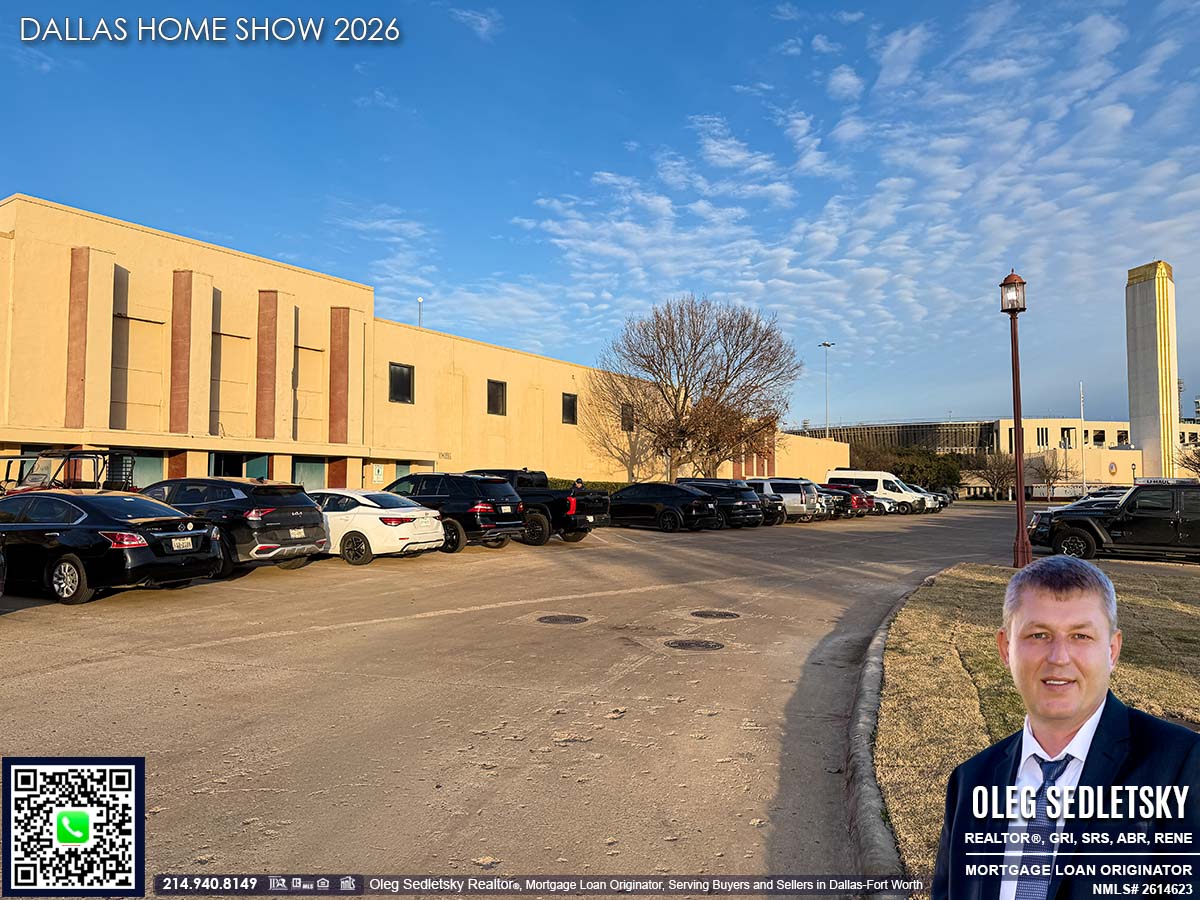
On January 17th, 2026 I visited the Dallas Home Show at Dallas Fair Park, the iconic home of the State Fair of Texas. I spent about six hours walking the floor, speaking with business owners, and vetting services to expand my personal list of recommended professionals. The biggest benefit of this event is efficiency. You can explore new products, compare companies, and speak directly to the experts all in one afternoon.


Contractors and Businesses That Really Stood Out to Me
As a Realtor®, Mortgage expert, and detail-oriented homeowner, I’ve learned to ask the specific questions to determine if a company or contractor truly knows their craft.
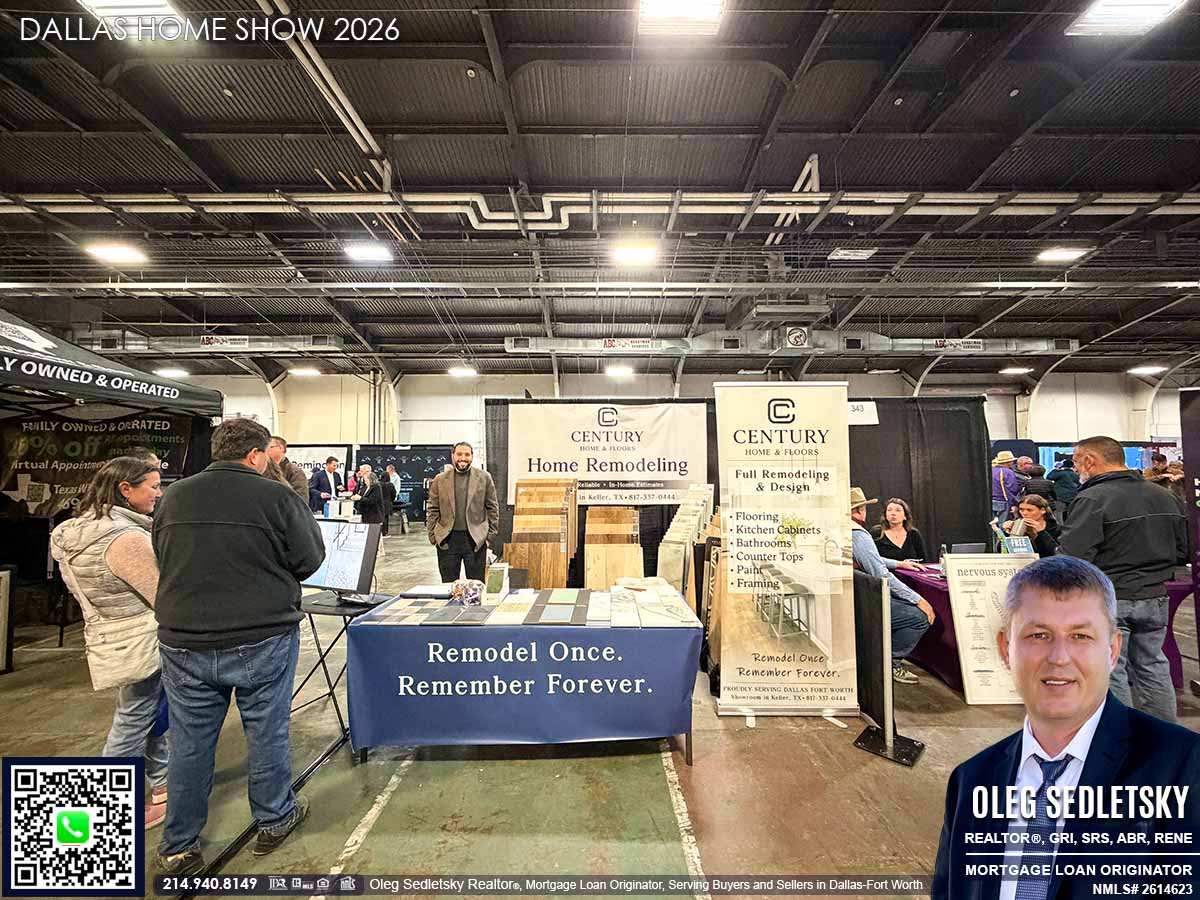
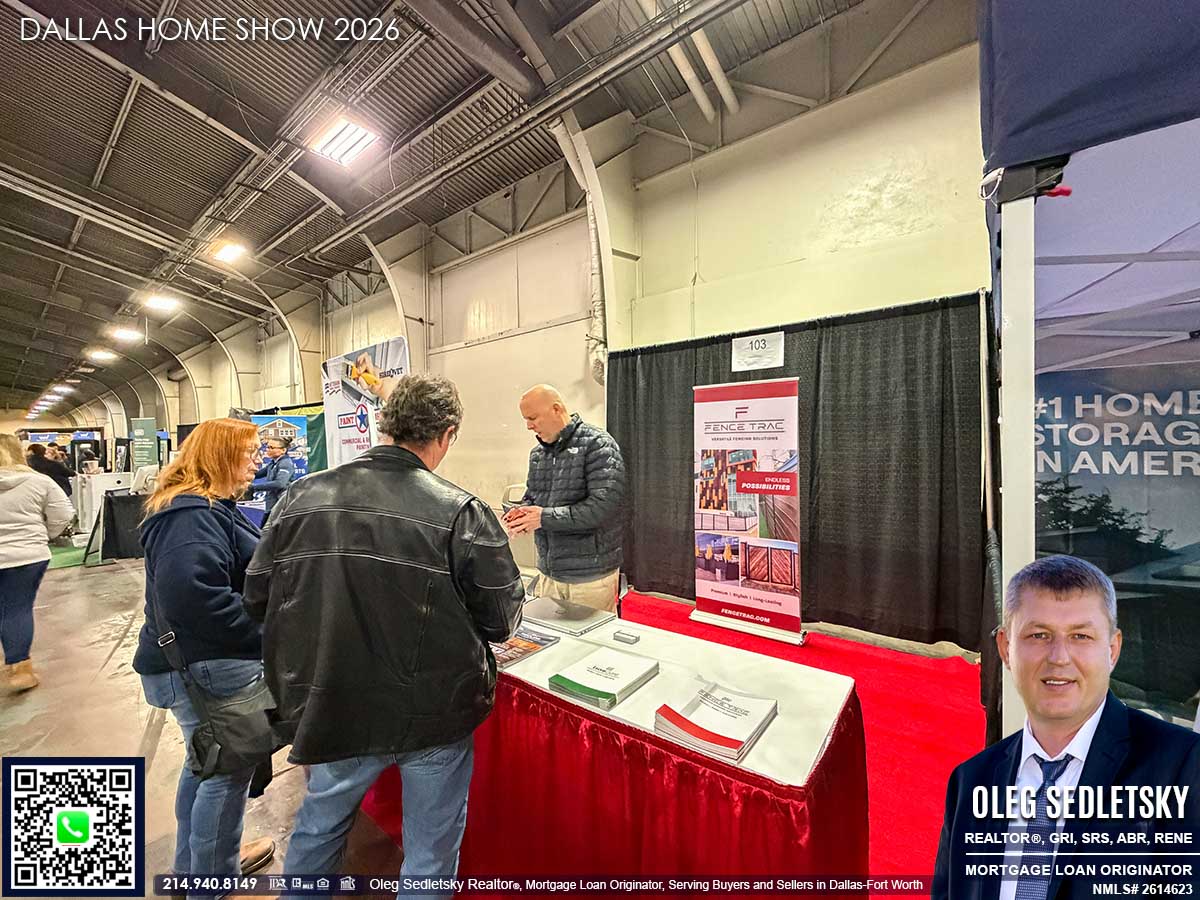
At the show, I spoke with a variety of contractors, from small businesses to larger companies.
Many impressed me with their knowledge and craftsmanship, and I want to share my findings with you.
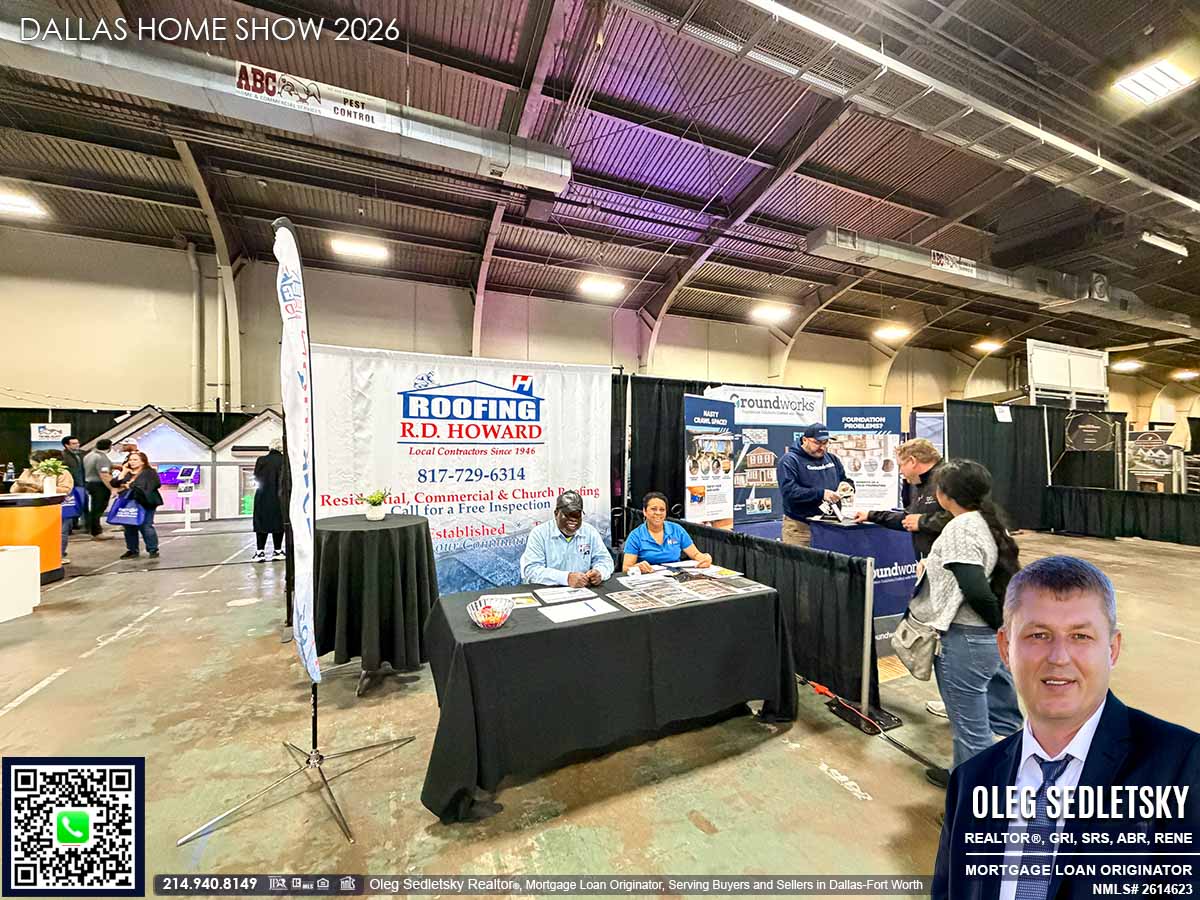
Roofing
Your home’s roof serves as its first line of defense against the elements. I had an in-depth conversation with Mr. Burt Chandler of Burt Chandler Company Inc., a highly knowledgeable roofing contractor. His expertise and deep understanding of the craft were truly impressive. Our discussion was both insightful and productive, and it was clear that his level of knowledge comes from years of experience and dedication to the industry.
www.burtchandler.com
(817) 205-9021

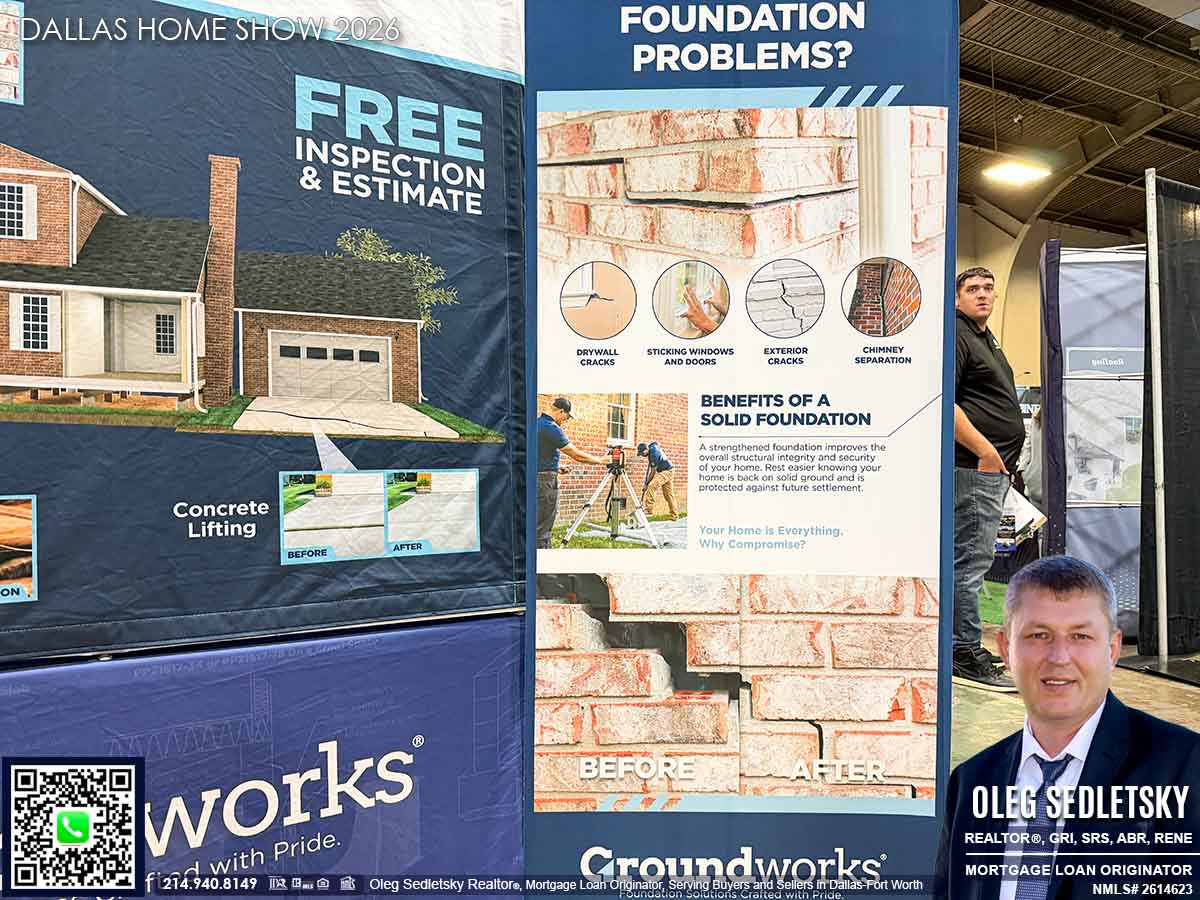
Foundation Repair
While basements are almost nonexistent in Dallas, soil movement is a challenge we can’t ignore. Foundation repair is a critical service, especially for older properties. I connected with specialists who understand the specific needs of Dallas foundations.

Kitchen Cabinet Upgrades
While full remodels are popular, I noticed a strong demand for custom cabinet drawers. Two companies were showcasing these solutions. For a seller, having organized, high-quality drawers is a fantastic selling point.


Epoxy Flooring
I would argue that epoxy flooring is a must-have for any modern garage. It protects the concrete and looks incredible. It is one of those upgrades that instantly elevates the feel of the home.

Wall Printing
One of the more fascinating finds was a company specializing in wall printing. They can print a mural or custom graphic on nearly any vertical surface! It is not a necessity, but it is a unique way to personalize your space.


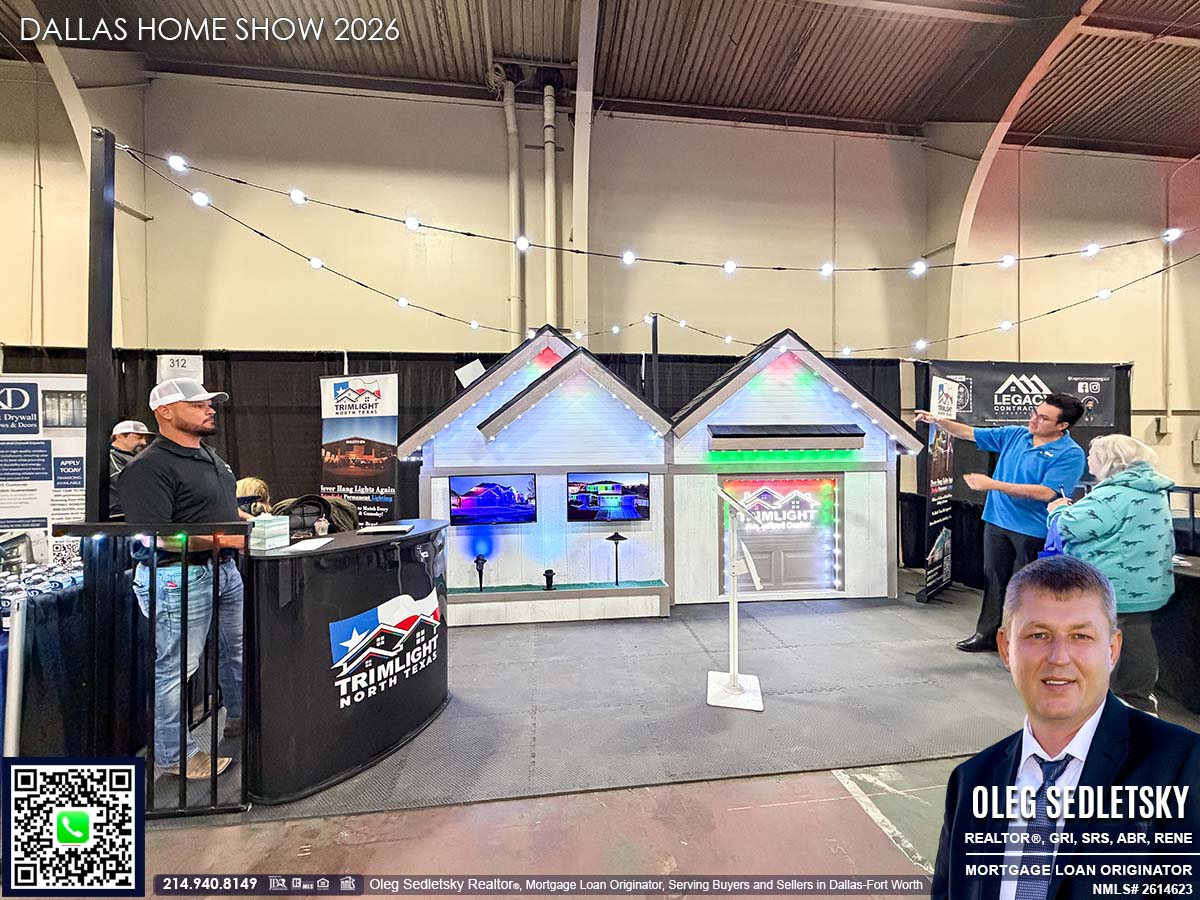
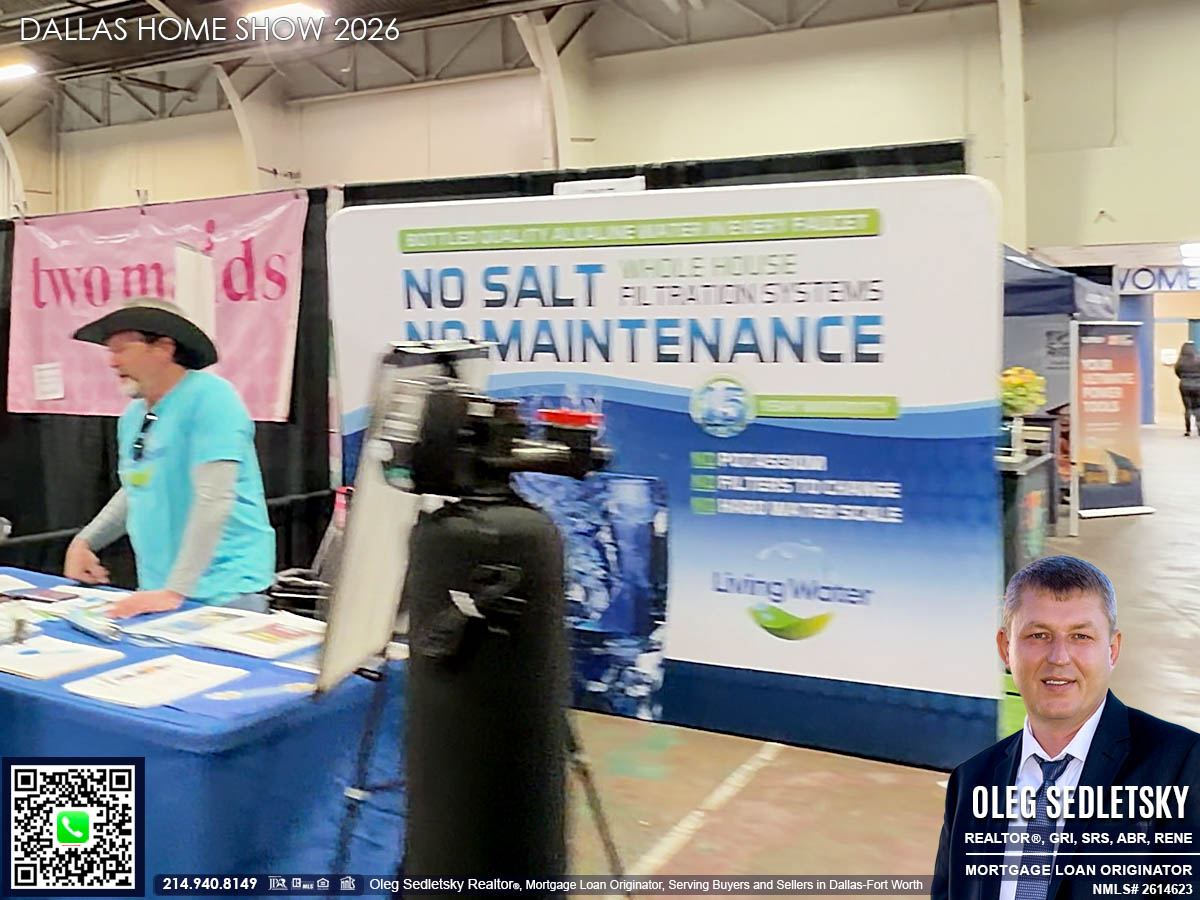
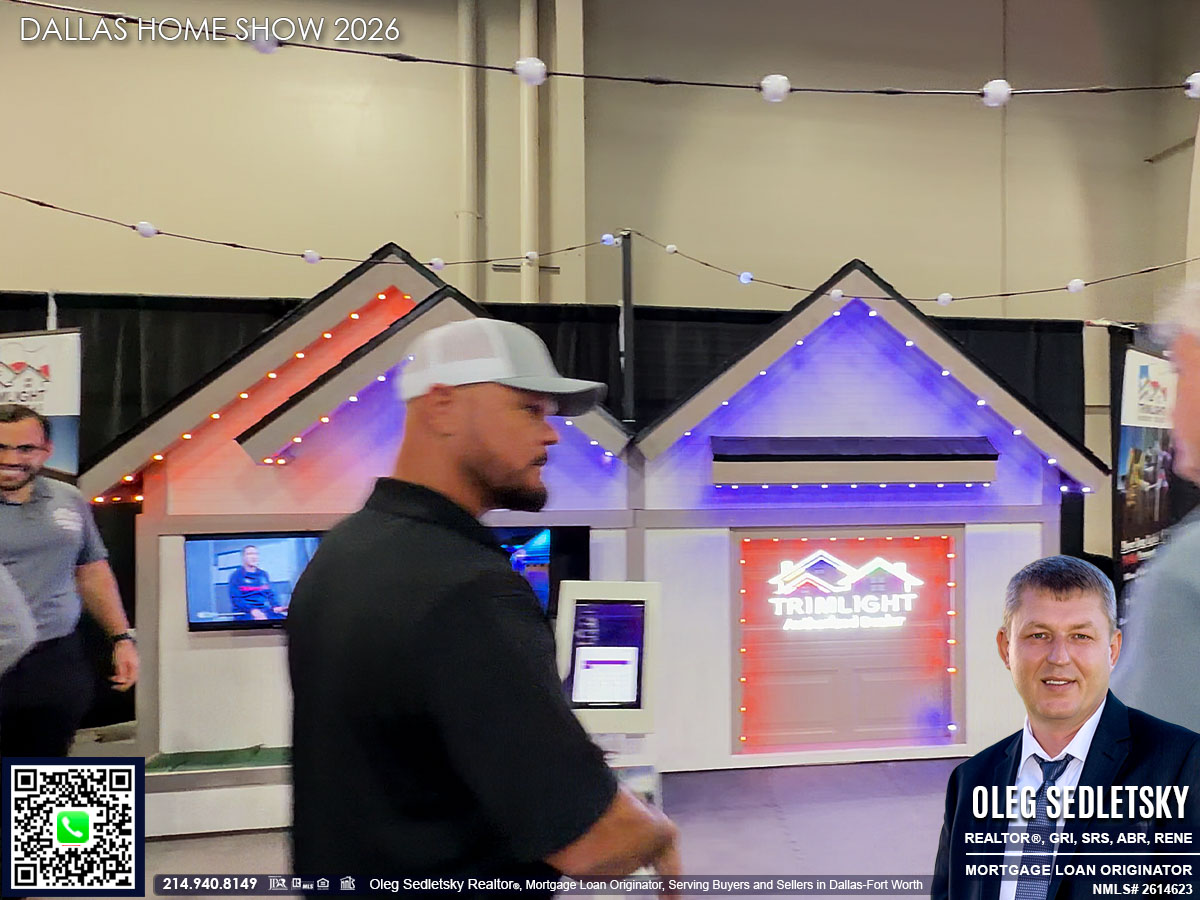
Permanent Lighting
This trend is exploding in popularity. It eliminates the need to hang seasonal holiday lights ever again. Two companies at the show were constantly busy providing quotes. It is a convenience that also boosts curb appeal.
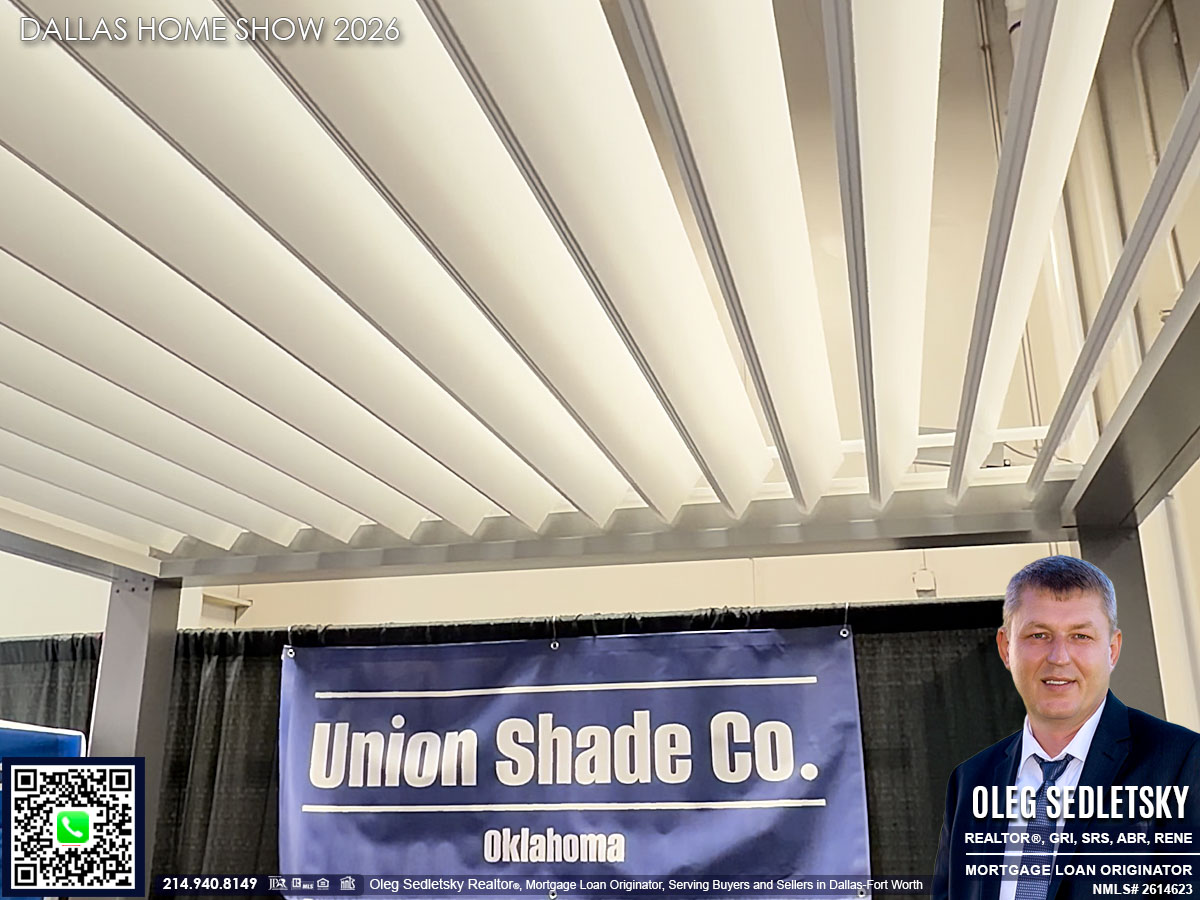
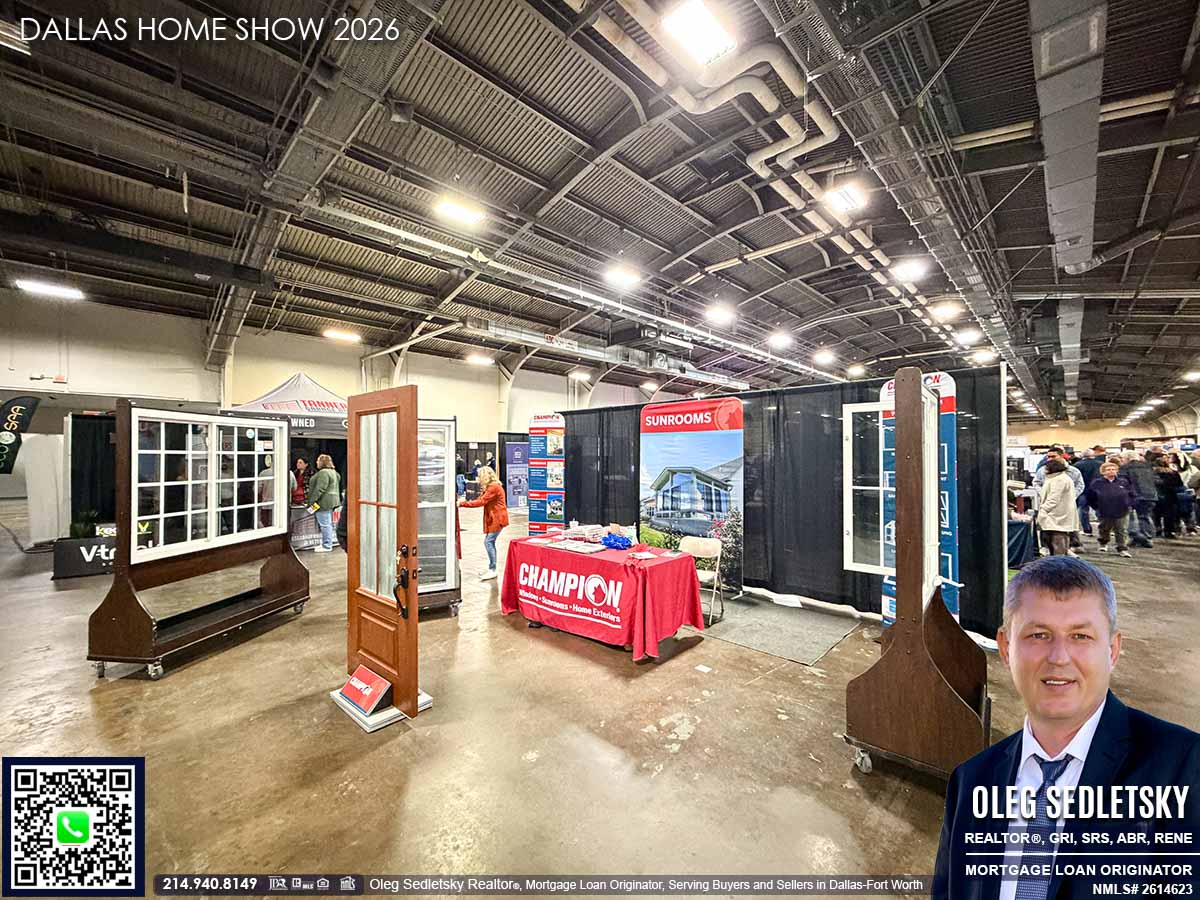
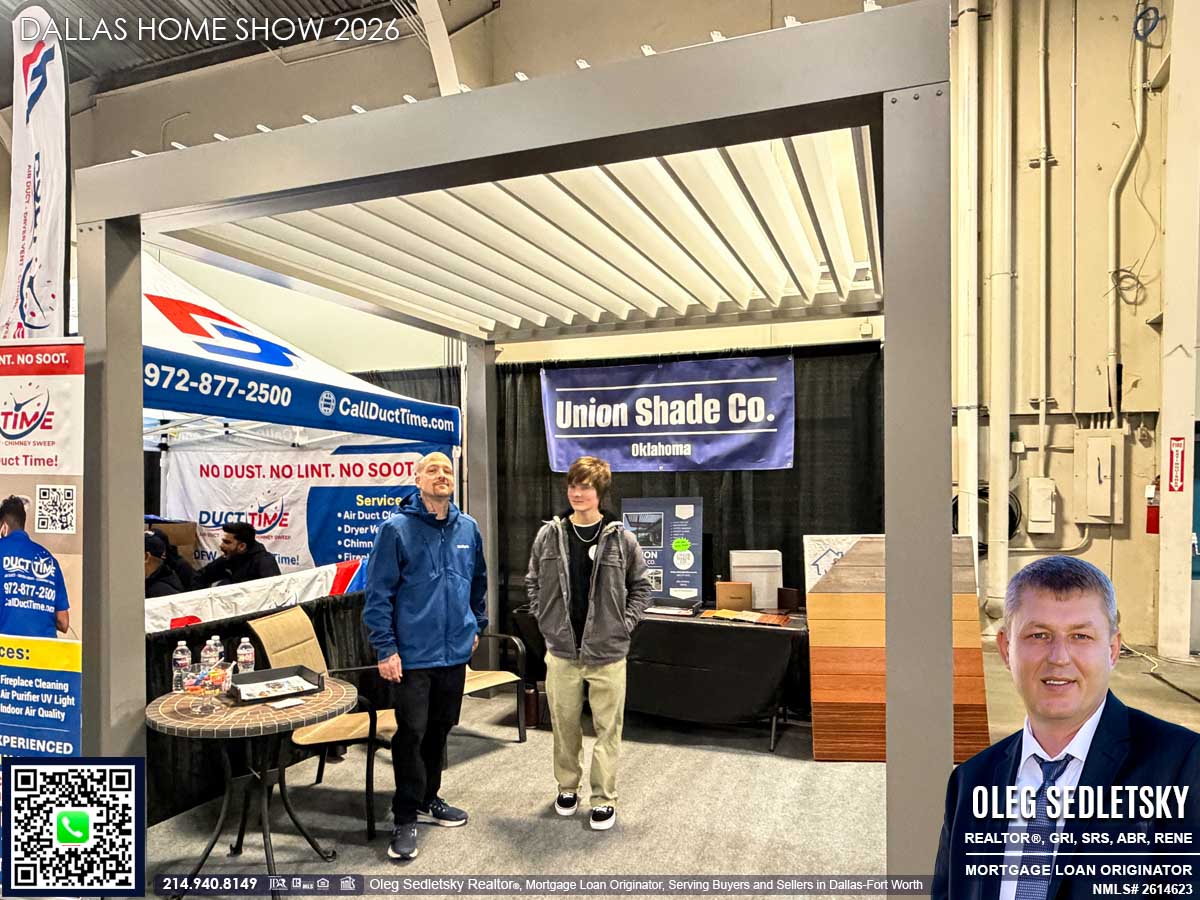
Pergolas and Outdoor Screens
Outdoor living is huge in Texas. I saw beautiful custom aluminum pergolas that feature retractable screens and motorized louvered roofs. These structures allow you to enjoy your patio regardless of the sun or bugs.

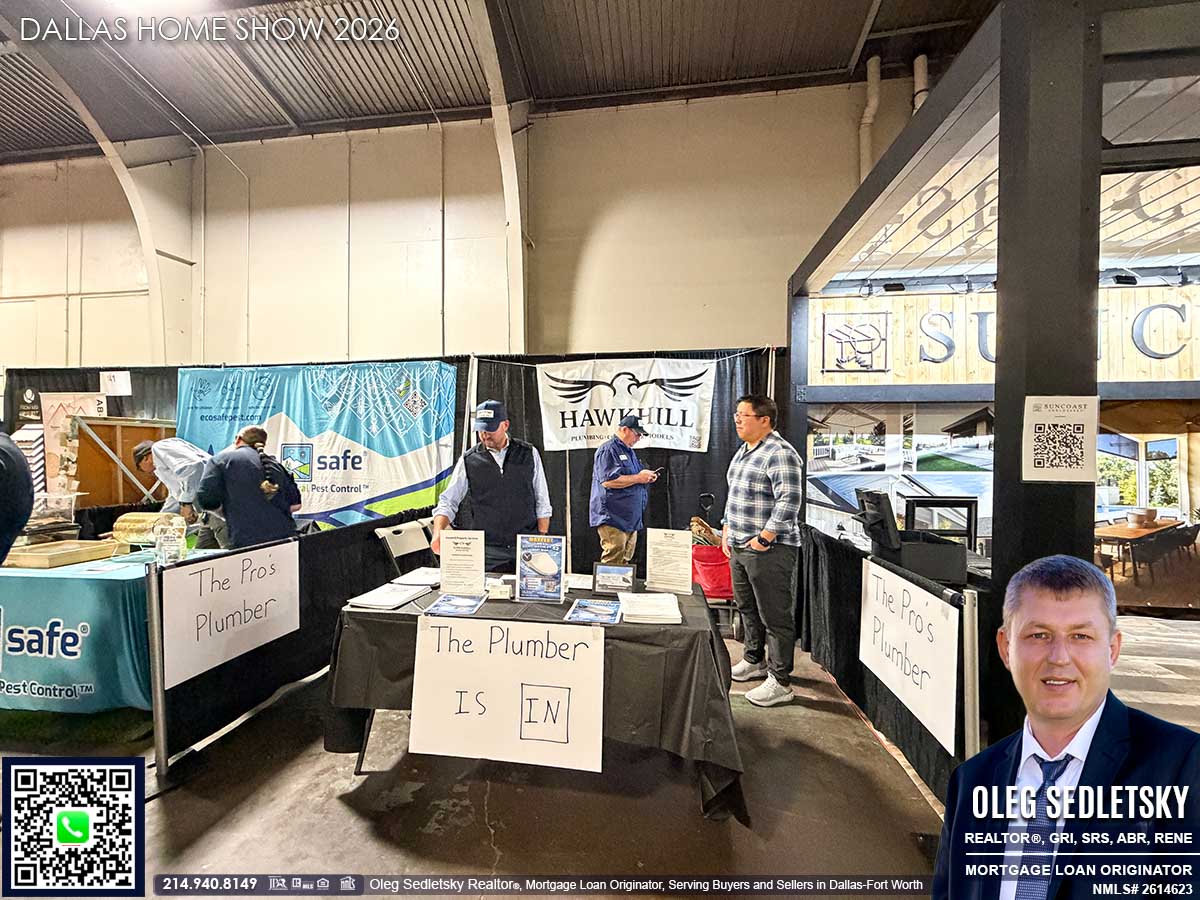
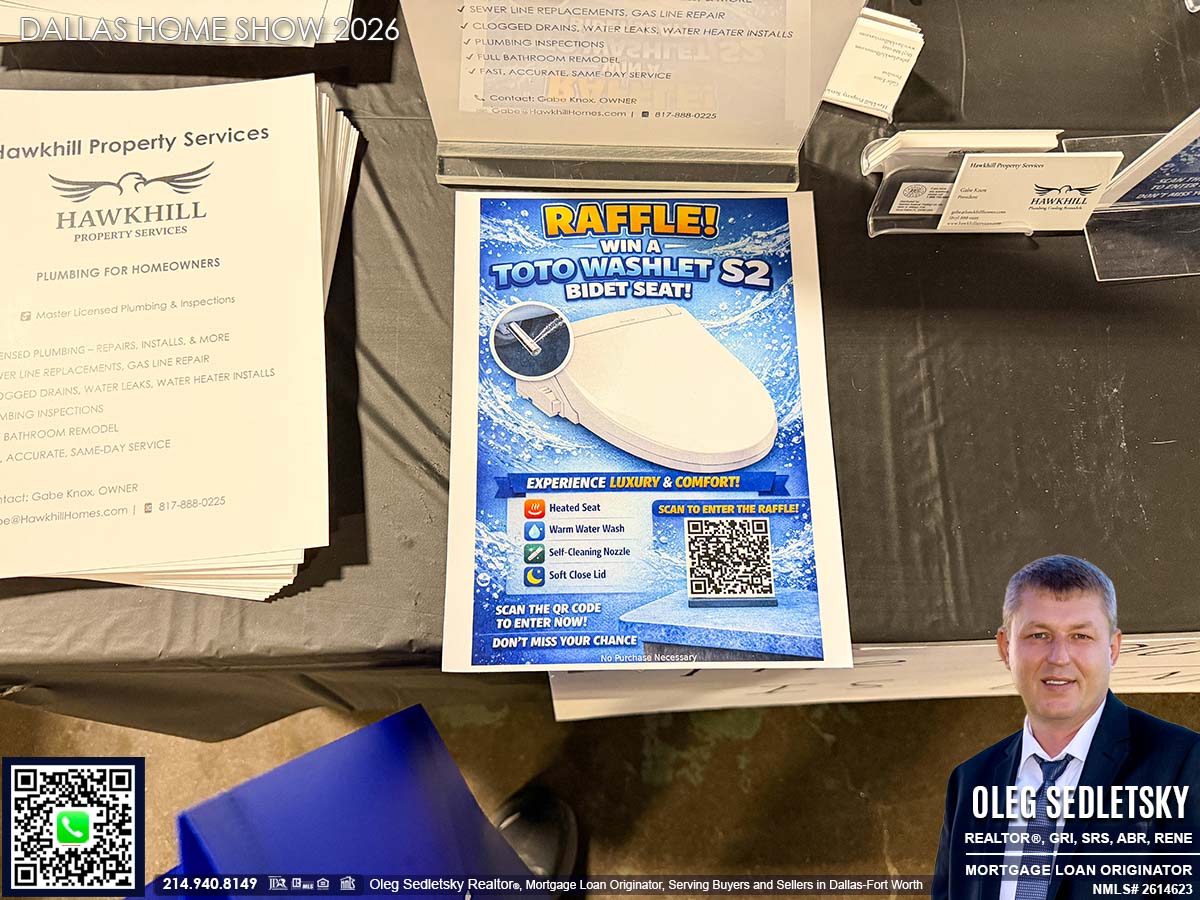
Plumbing
You really want to have a few plumbers on your emergency list. I connected with trustworthy professionals at the show who handle everything from leaks to major installations.
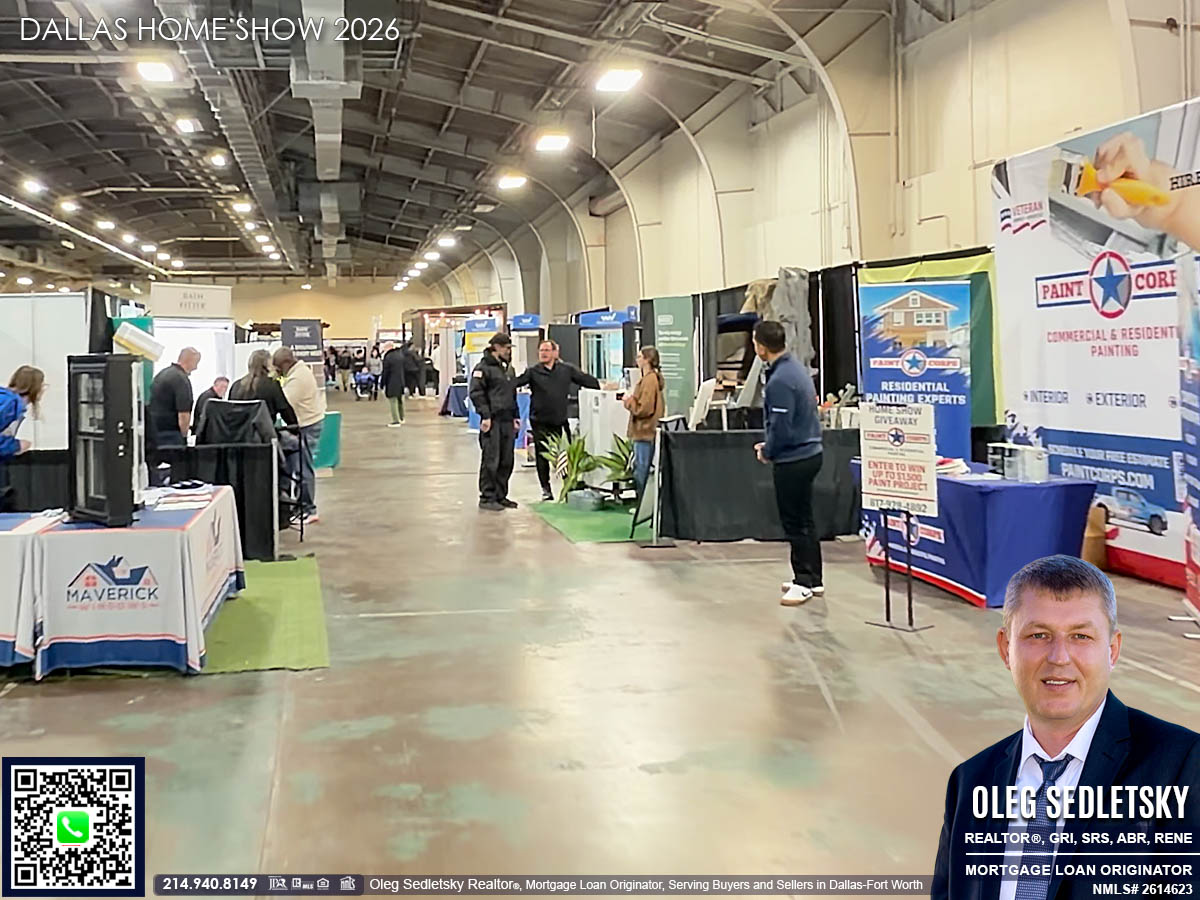
Painters
Painters are always needed, especially when it is time to sell the house. Fresh paint is a huge selling point that can transform the look of a property instantly.


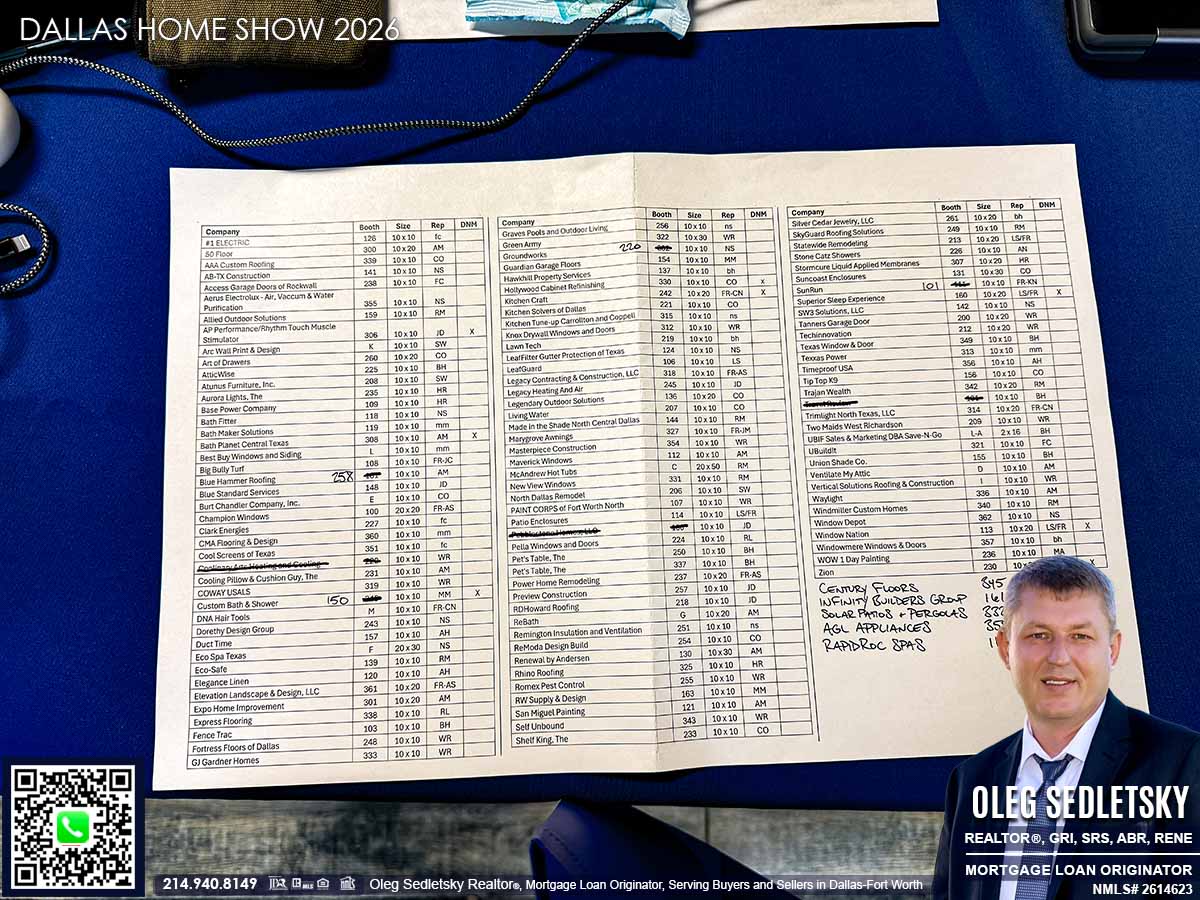
Full List of Contractors
I took a photo of the full list of vendors who participated in the 2026 Dallas Home Show for you to review at your convenience. You can refer to this image to find contact details for the specific businesses mentioned above and many others.
Practical Strategies for Tackling Home Improvement Projects
Whether you plan to attend the next show or are just starting to think about future projects, here is some actionable advice.
- Build Your Team Now. Do not wait for an emergency. Create a list of contractors categorized by service: “Urgent” for plumbing and electrical, “Maintenance” for painting and pest control, and “Wish List” for remodeling and landscaping.
- Ask Direct Questions. When you meet a professional, inquire about their licensing, insurance, and warranty process. Their answers will reveal a lot about their commitment to quality and customer service.
- Get Preliminary Estimates. Use the show to gather ballpark pricing for projects you have in mind. Homebuyers can use this information in negotiations, while homeowners and sellers can use it for budgeting.
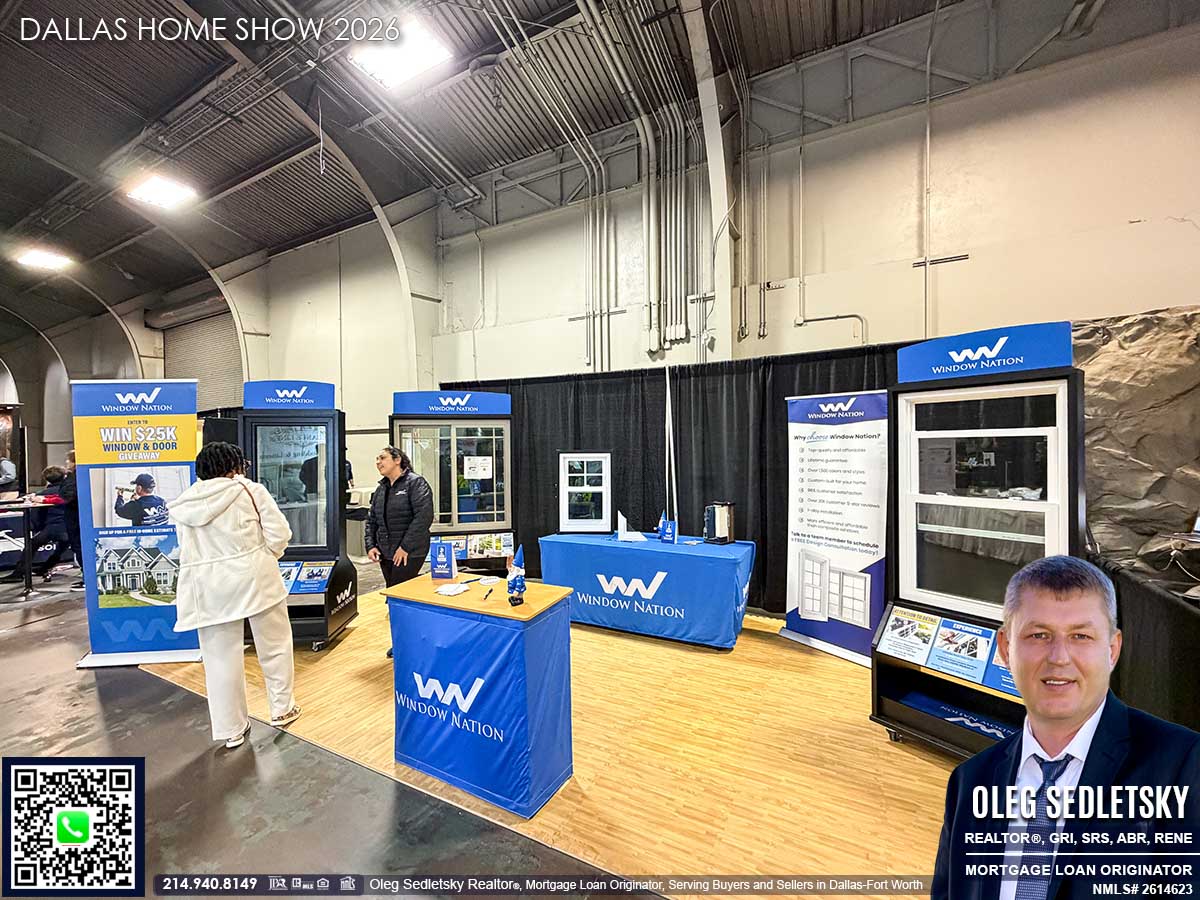
- Observe the Trends. Pay attention to what is in high demand. Features like custom pergolas, motorized blinds, and energy efficient windows are popular for a reason. They add comfort and value.
Move Forward with Your Home Goals
The difference between a stressful property and a valuable asset often comes down to the team you have in your corner. The Dallas Home Show is an excellent place to find those skilled professionals. For homebuyers, this knowledge is power during negotiations. For homeowners, it provides a roadmap for future upgrades. For sellers, strategic improvements can make a significant impact on your final sale price. Start building your list of trusted contractors today; you will be glad you did!
My Dallas Home Show Photo Gallery – Over 100 Photos I Captured
Explore the exhibits and meet the professionals who made the event special. Below, you’ll find a gallery with more than 100 photos I captured during the show.


Hey Home Buyers! Are you excited to experience the joy of homeownership in the vibrant Dallas-Fort Worth area?
Buying a home in the Dallas-Fort Worth area should feel exciting, not overwhelming. Whether you’re eyeing a charming pre-owned house or a fresh new build, I’m here to make the home buying process simple and straightforward.
I’ll be here to answer your questions, handle the details, and make sure everything falls into place. My goal is to help you buy a home that checks all the boxes for you.
Let’s get started. Fill out my quick Homebuyers contact form and I’ll take it from there.
Hey Home Sellers! Considering selling your home in the Dallas-Fort Worth area?
Selling a home is like preparing for a big game. You need a solid game plan, the right coach, and a strategy to win. As a Realtor with a Seller Representative Specialist (SRS) designation, I’ll help you tackle every step, from pricing to closing, so you can walk away with a victory.
Fill out my Home Sellers form, and let’s get started.
Call/Text 214.940.8149

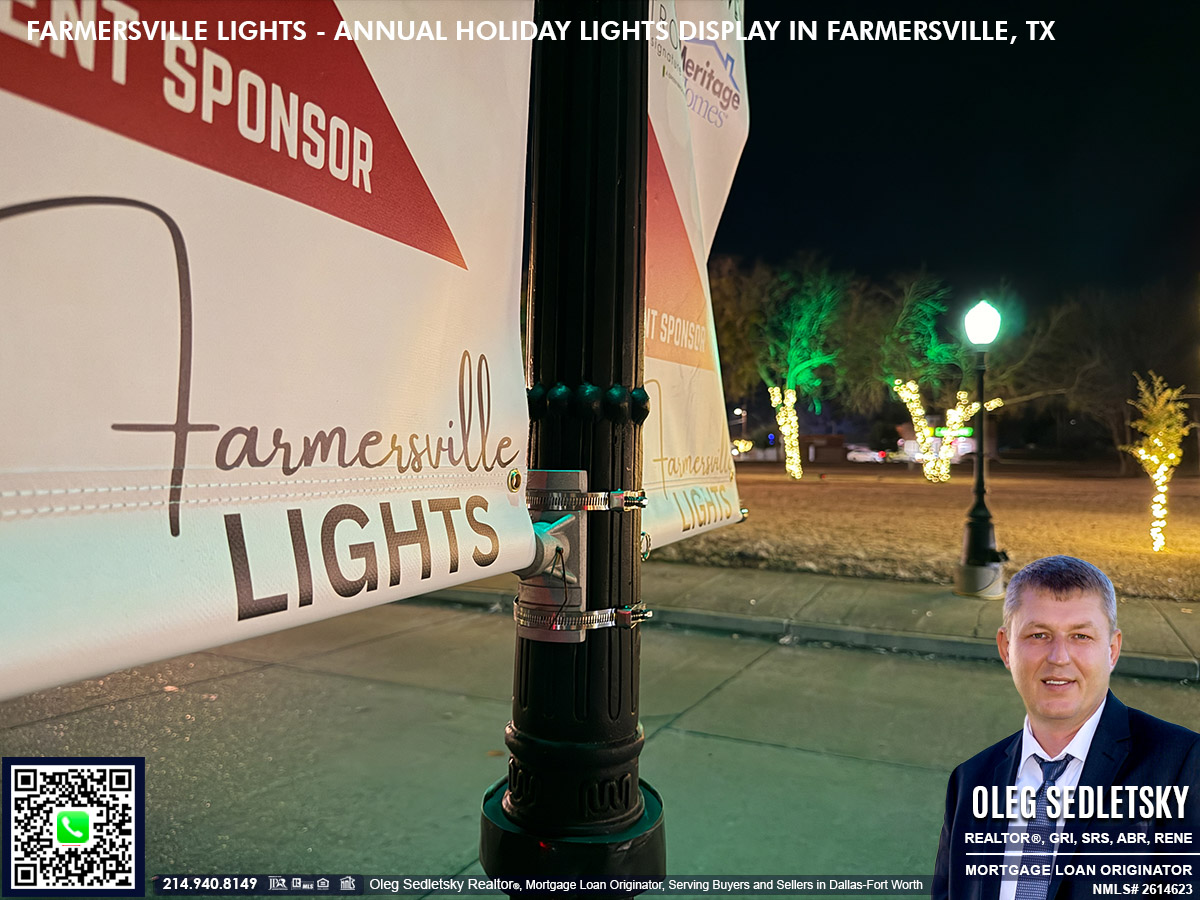
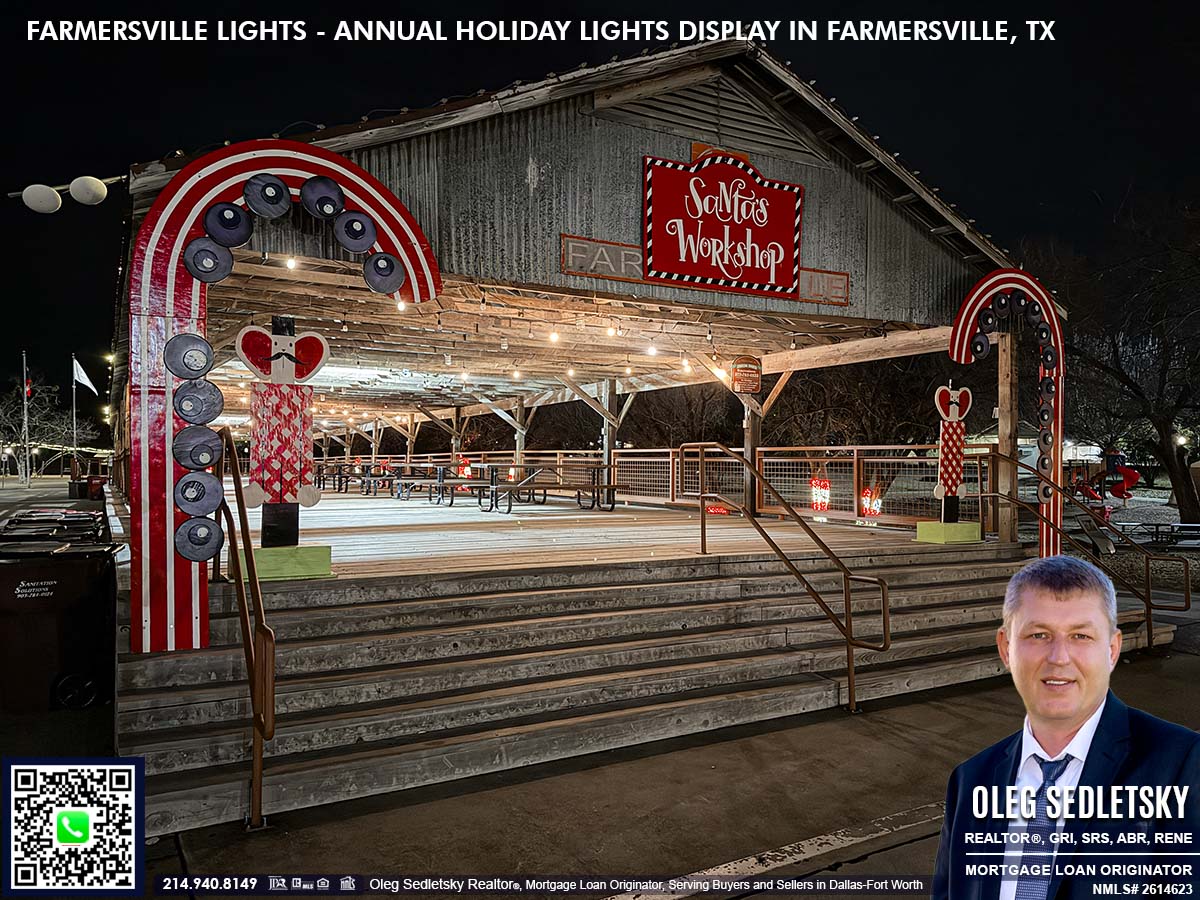
Things to Do in Farmersville, TX: Farmersville Lights – The Must-See Annual Holiday Lights Display and Top North Texas Attraction! Over 120 Photos
Farmersville Lights: A Small City’s Big Holiday Heart in North Texas
As a Realtor and Mortgage Loan Originator in the Dallas-Fort Worth area, I spend a lot of time on the road, getting to know the unique character of each North Texas community. It is part of my job to over-deliver for my clients, giving them the full picture of what life is like in different cities. That includes providing information on local attractions and even creating video road trips.
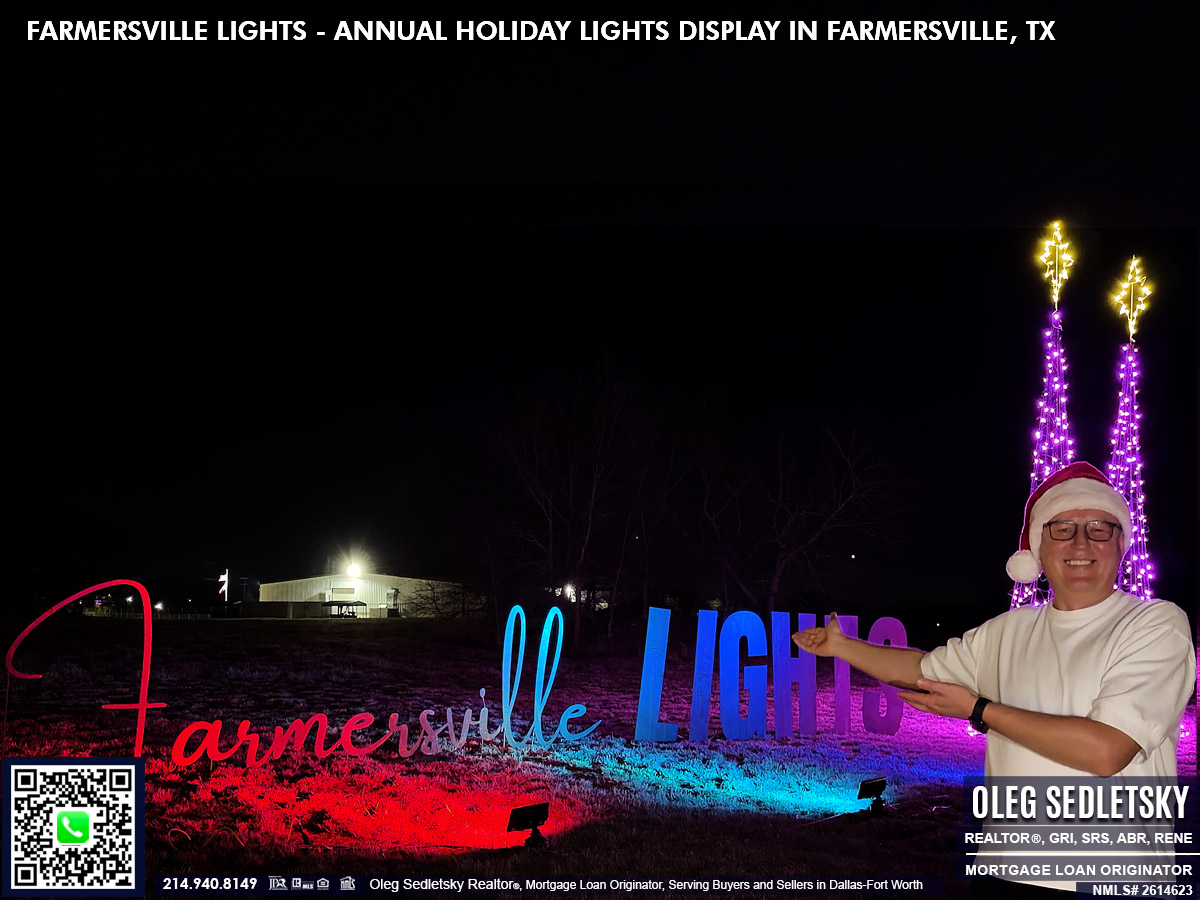
In December 2025, I visited Farmersville, TX, to experience their famous Christmas lights display, and what I found was truly special.
The weather was unusual for December in North Texas. It was a comfortable 72 degrees when I arrived around 6 pm. Despite the warmth, the moment I saw the glow on the horizon, the holiday spirit was undeniable. This small city knows how to celebrate the holidays, and it does so with a display of creativity and community that is simply amazing.
A Tradition Built by Community
The Farmersville Lights is a shining example of what a community can achieve when it comes together. It began in 2020 as a heartfelt idea from Mayor Bryon Wiebold, aimed at lifting spirits and supporting local businesses during challenging times. Since then, the event has grown into a cherished tradition, thanks to the tireless efforts of dedicated volunteers. Their commitment has transformed the display into a regional attraction, drawing thousands of visitors and providing a much-needed boost to the local economy. Some shop owners have even credited the event with keeping their doors open.
What makes the Farmersville Lights truly special is the collaboration behind it. The city lays the groundwork, local sponsors generously contribute to make the magic possible, and volunteers bring it all to life with their hard work and passion. Together, they turn Farmersville into a festive wonderland each year, creating an experience that is not just for the community but built by the community.
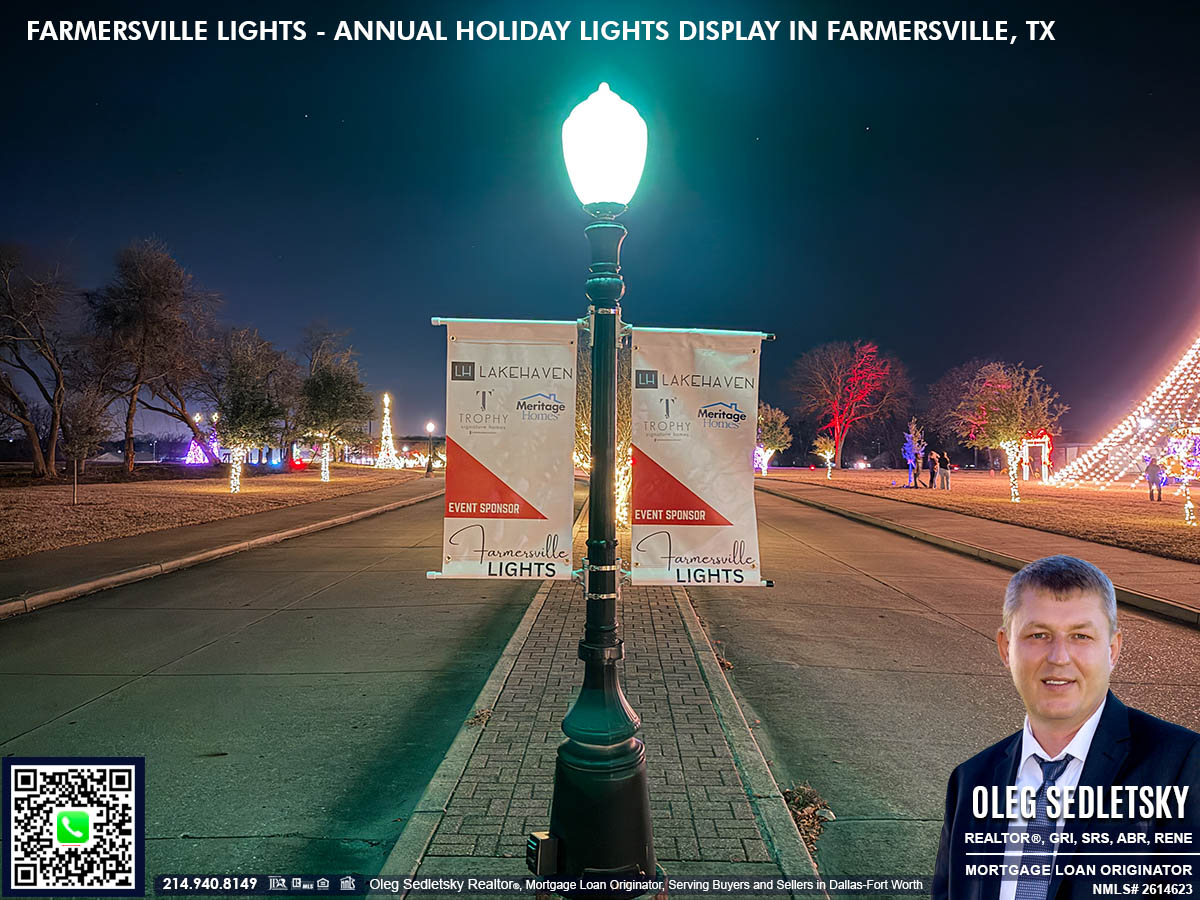
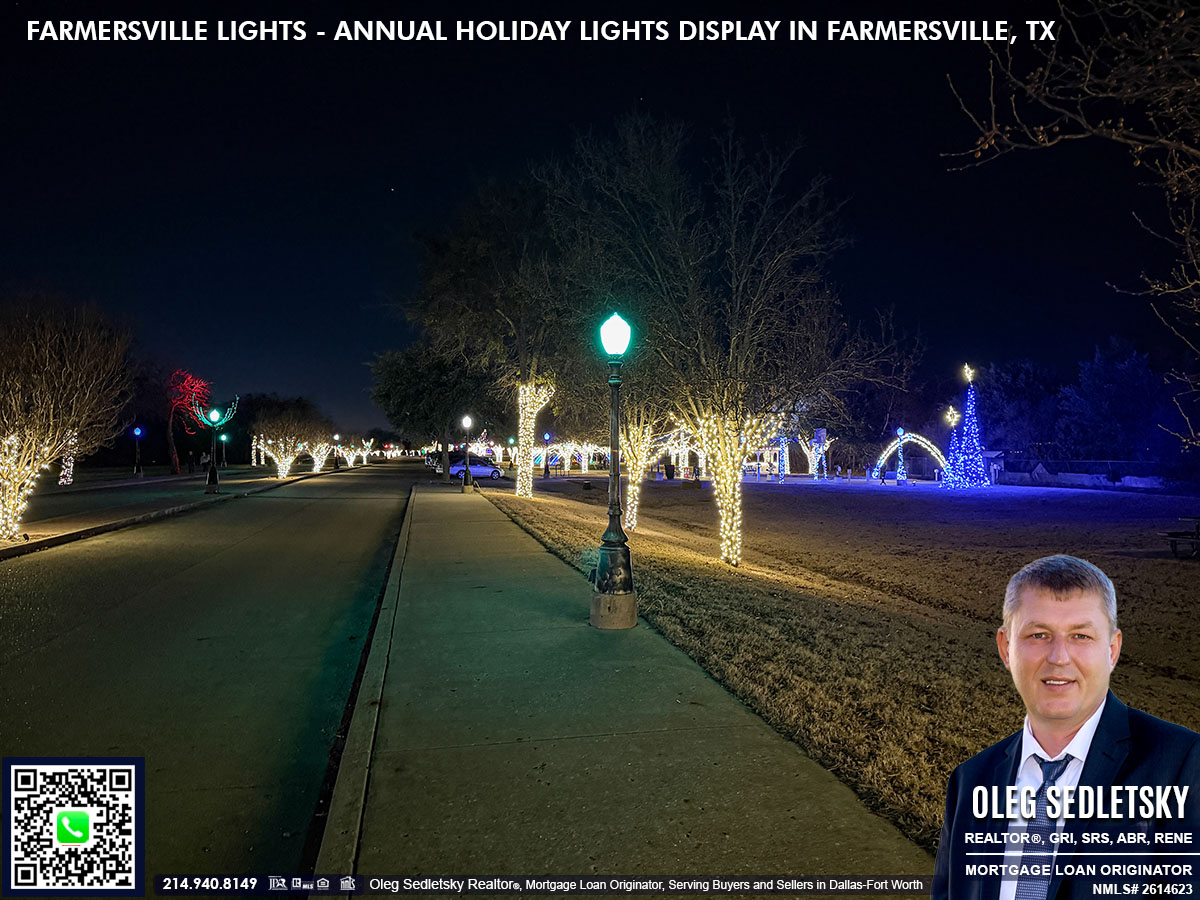
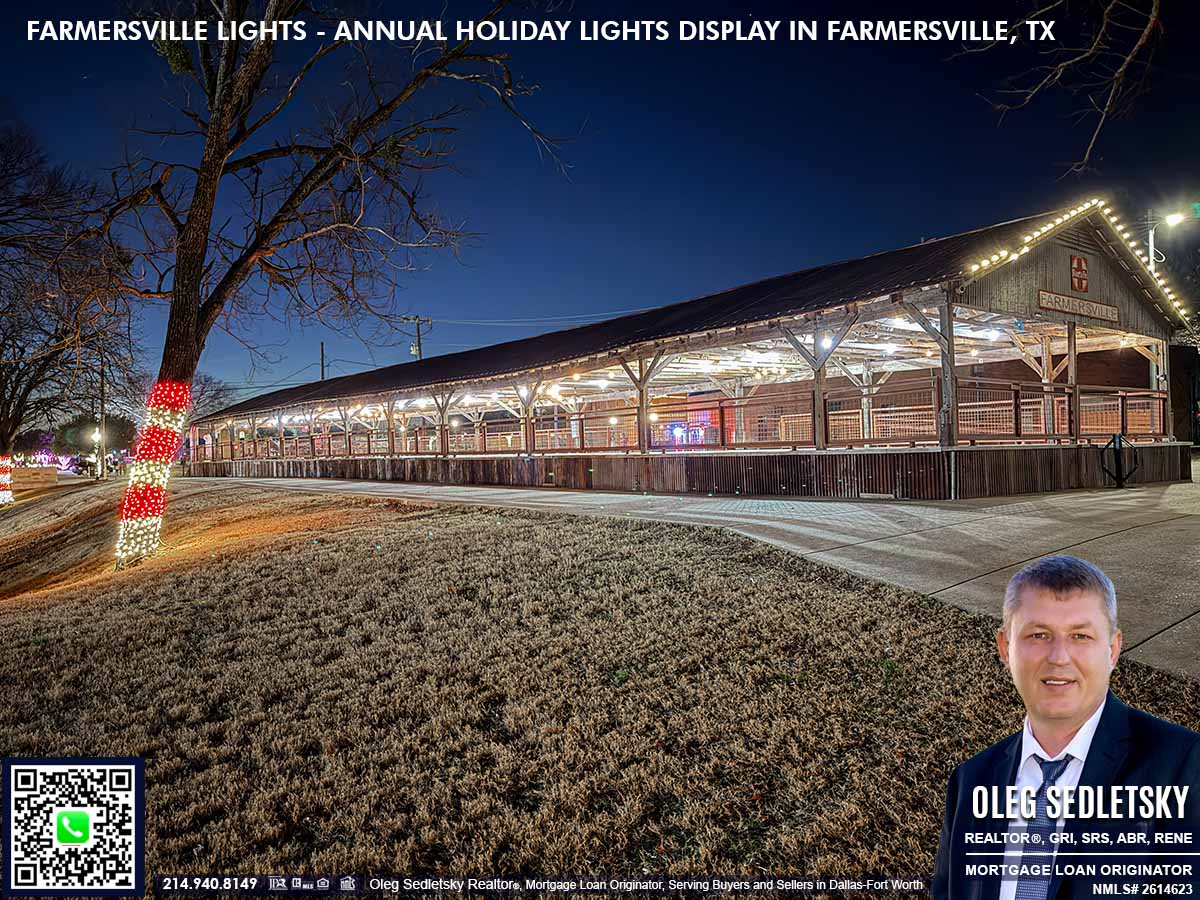
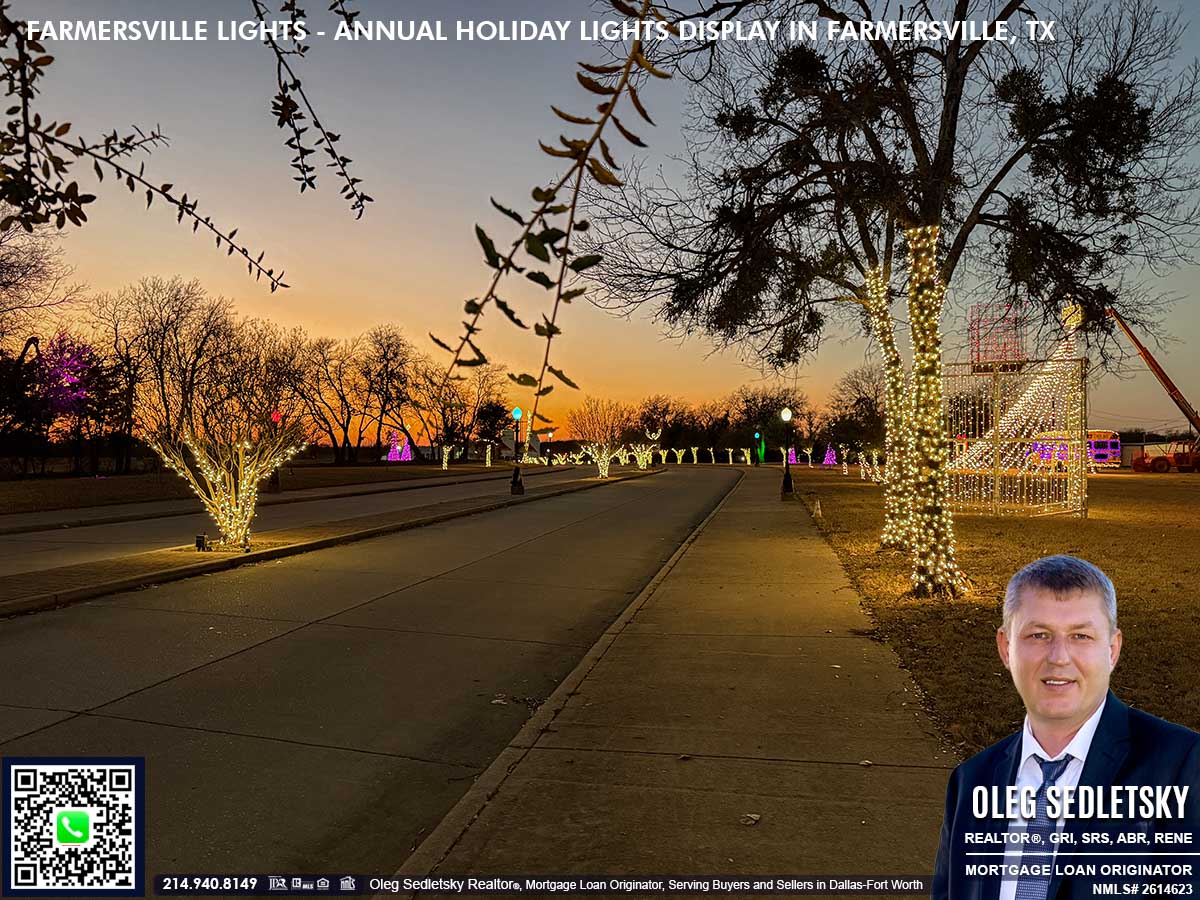
A Walk Through a Holiday Wonderland
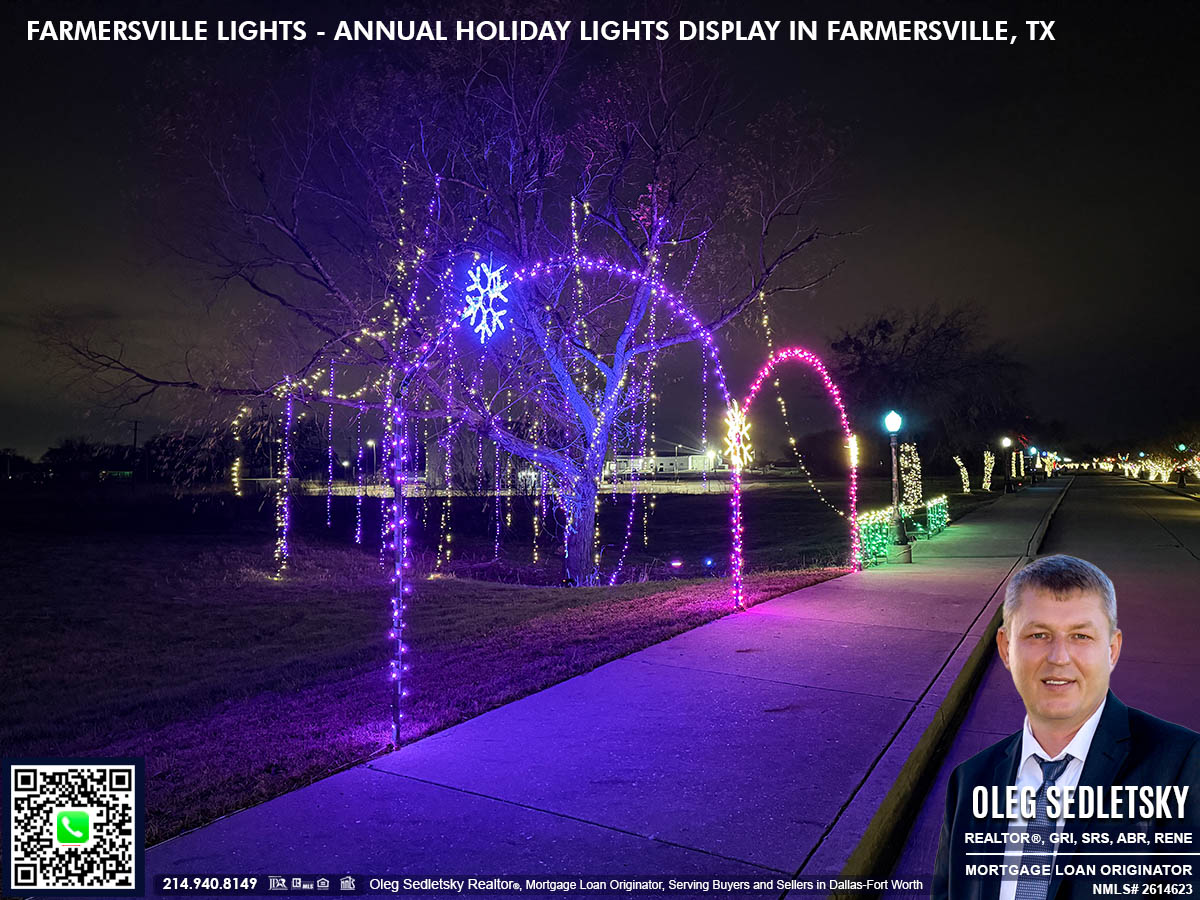
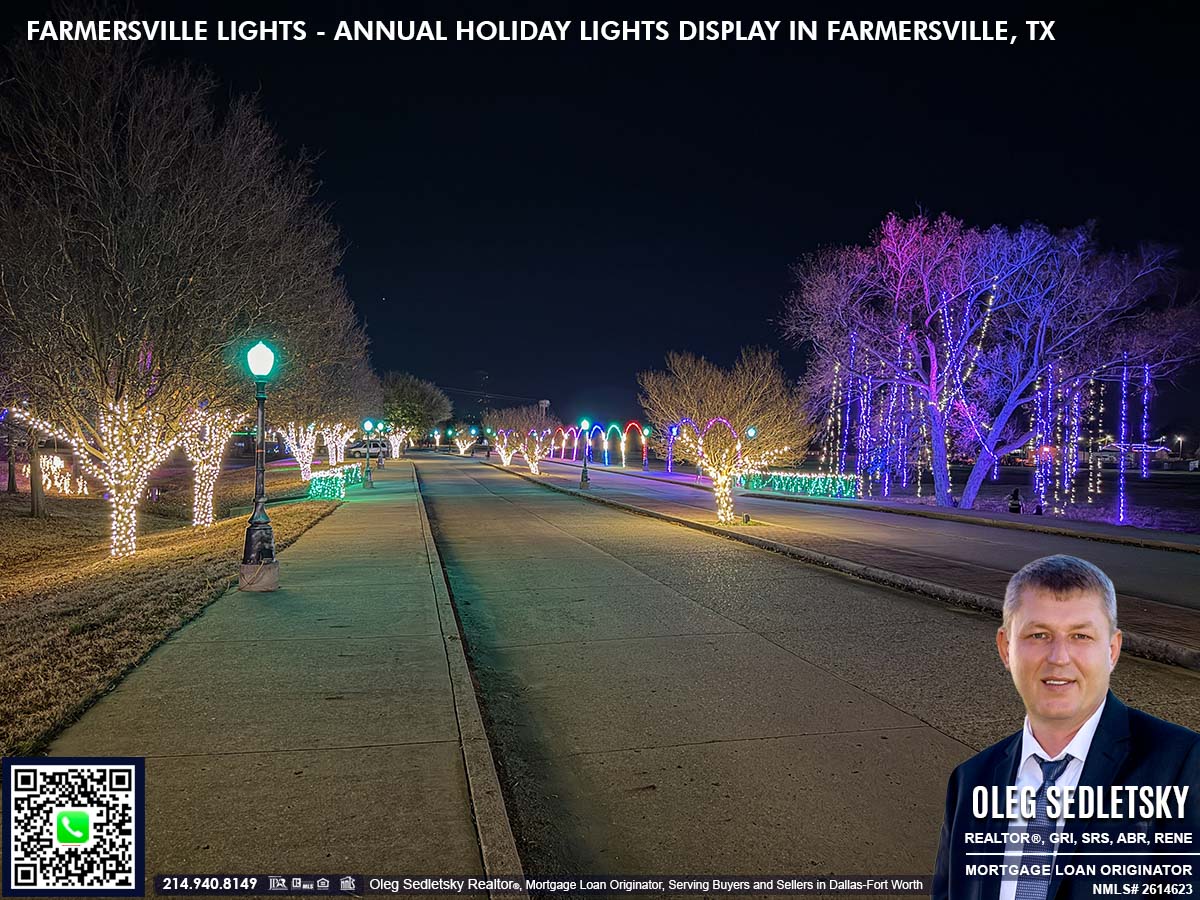
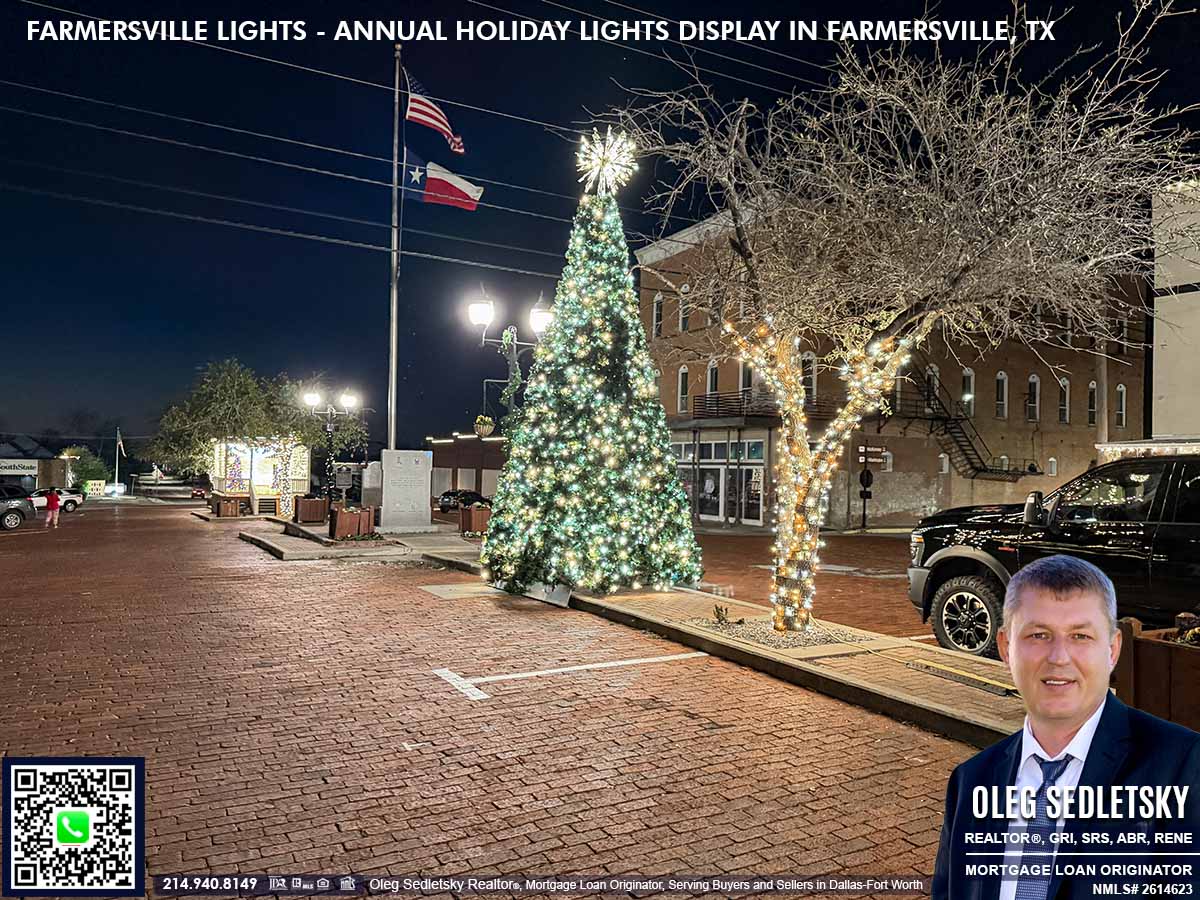
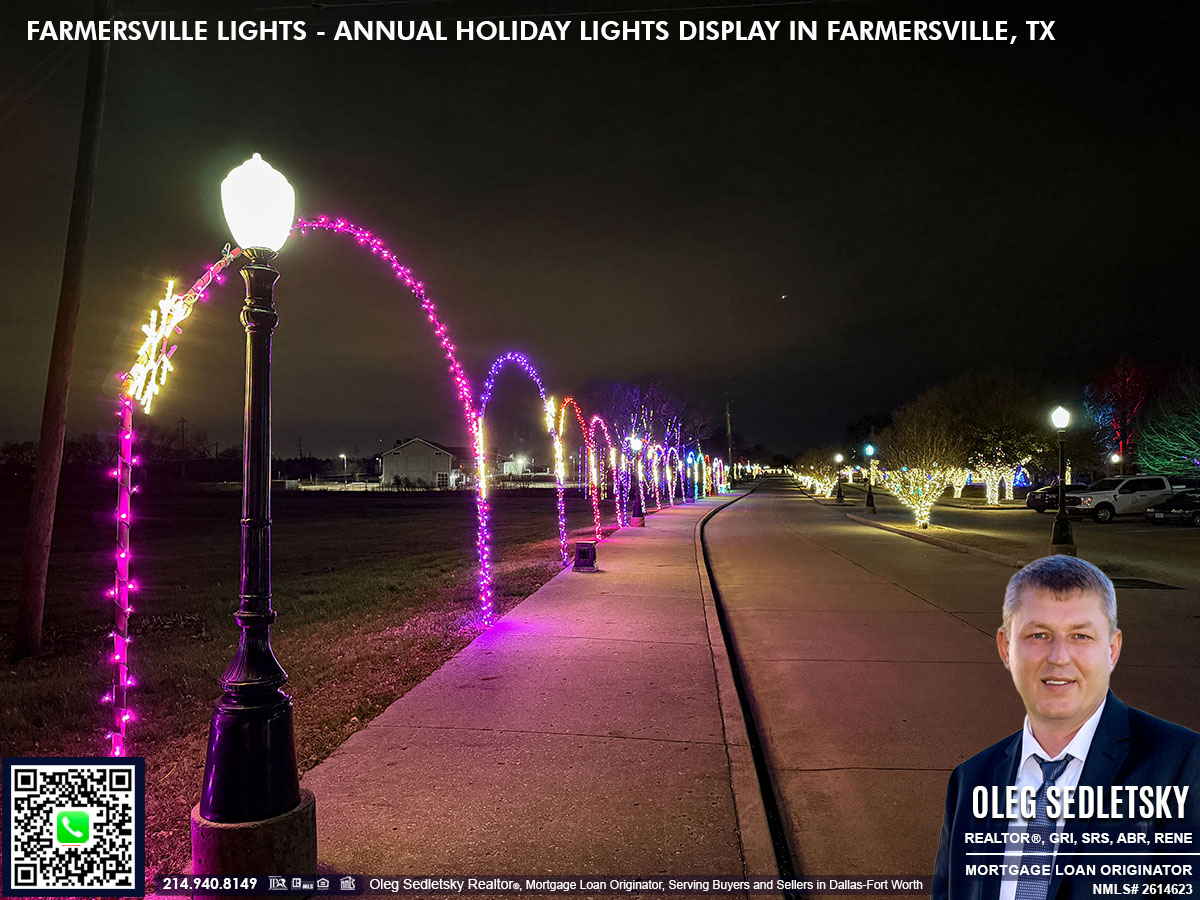
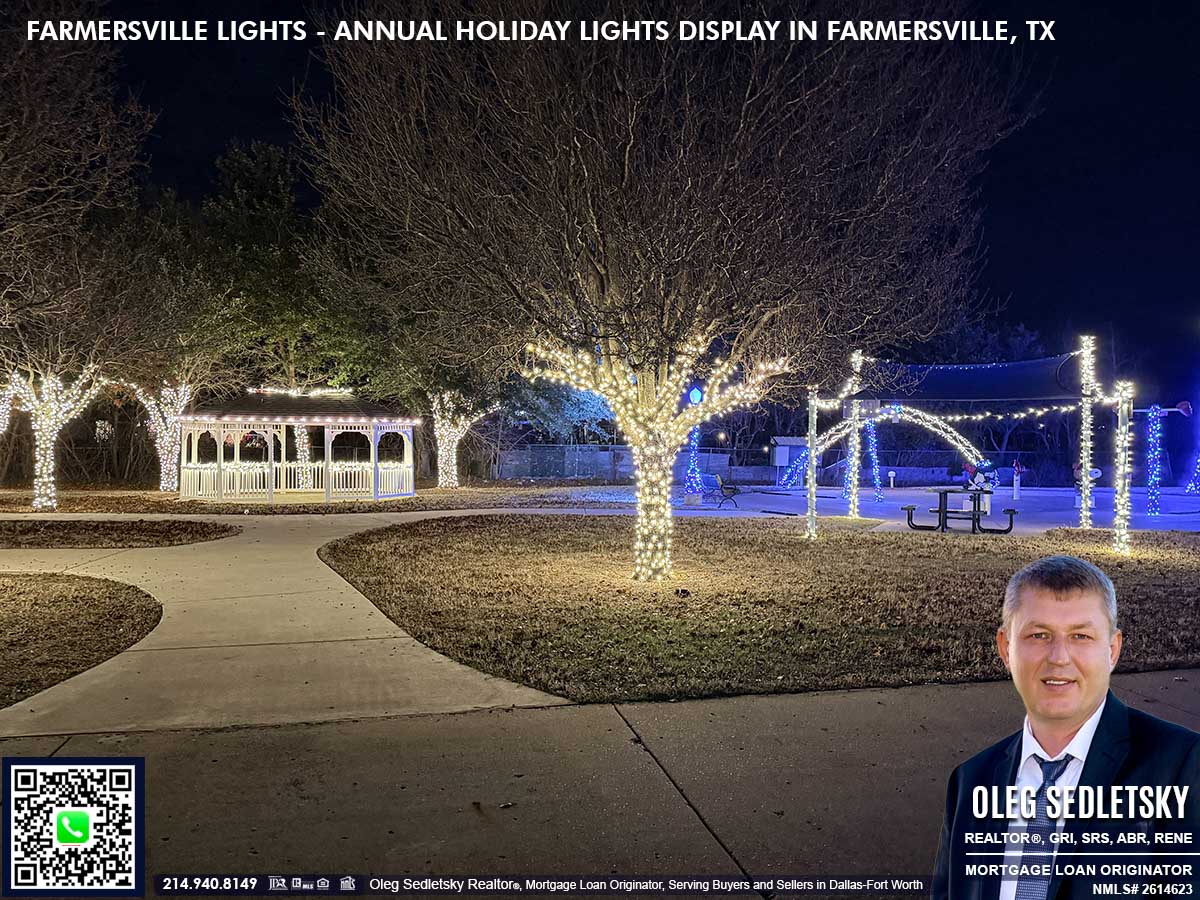
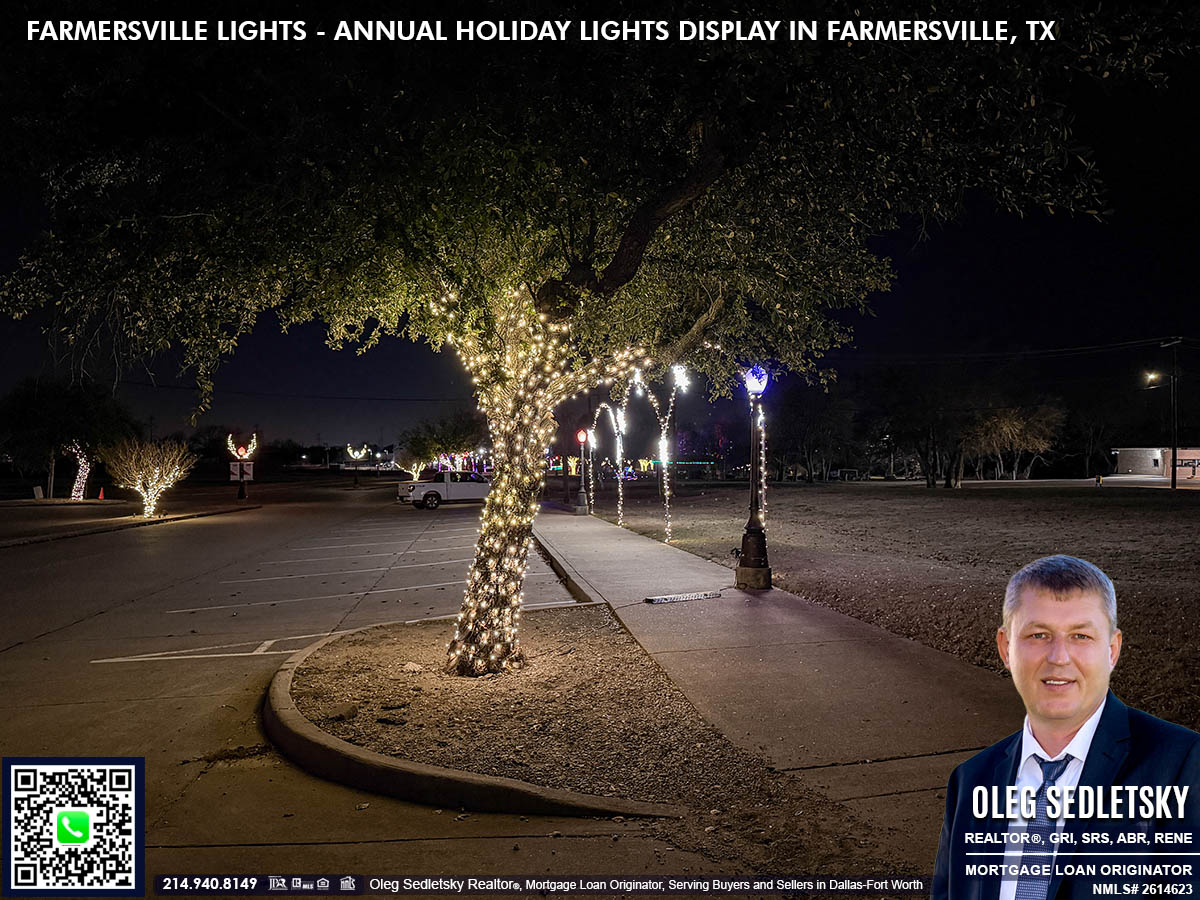
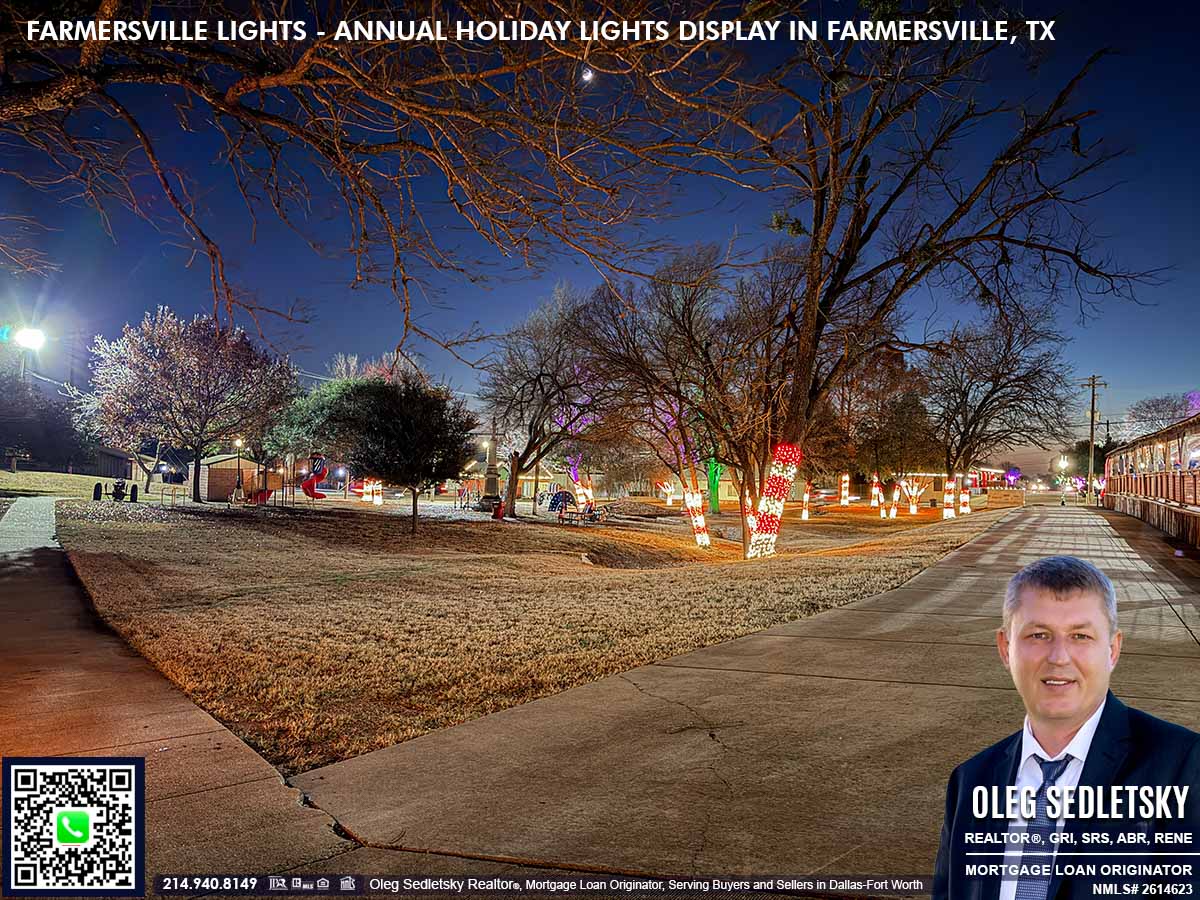
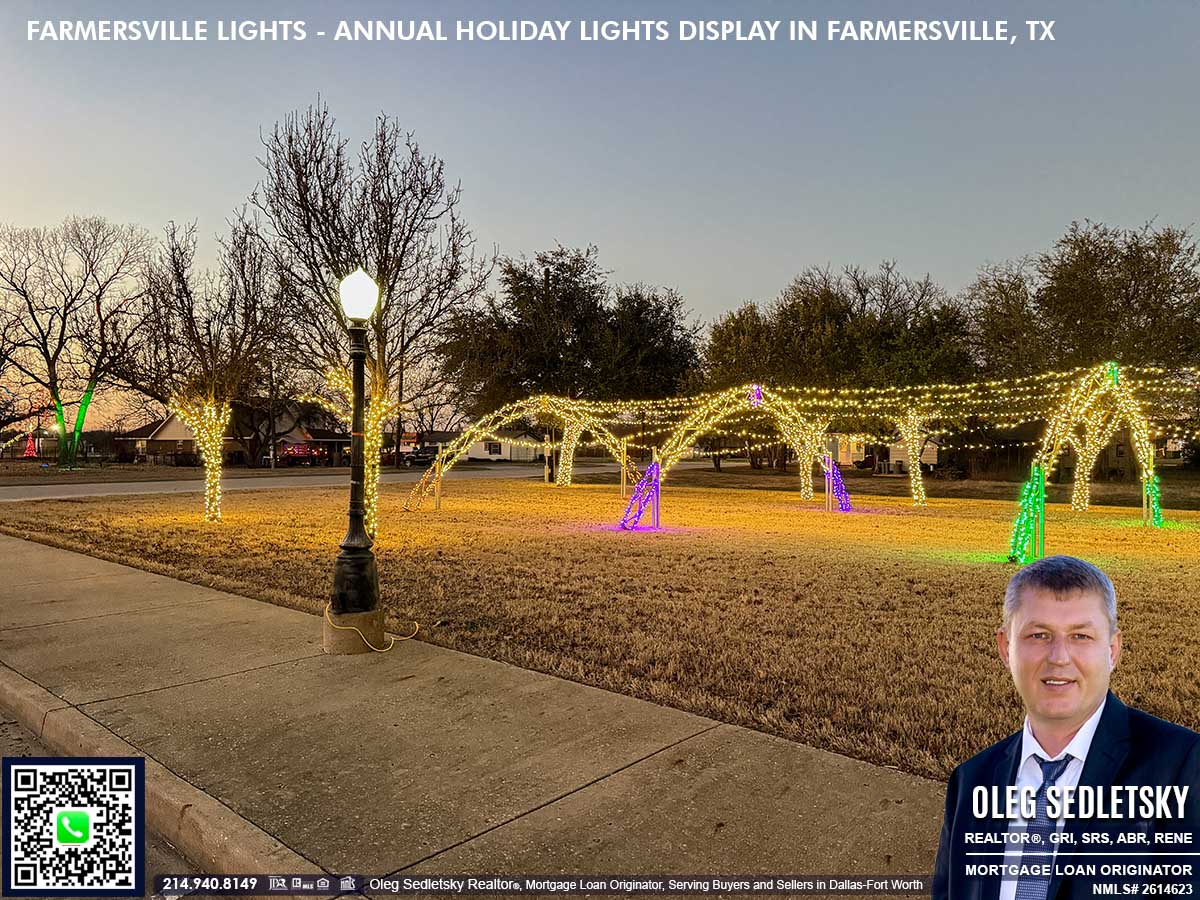
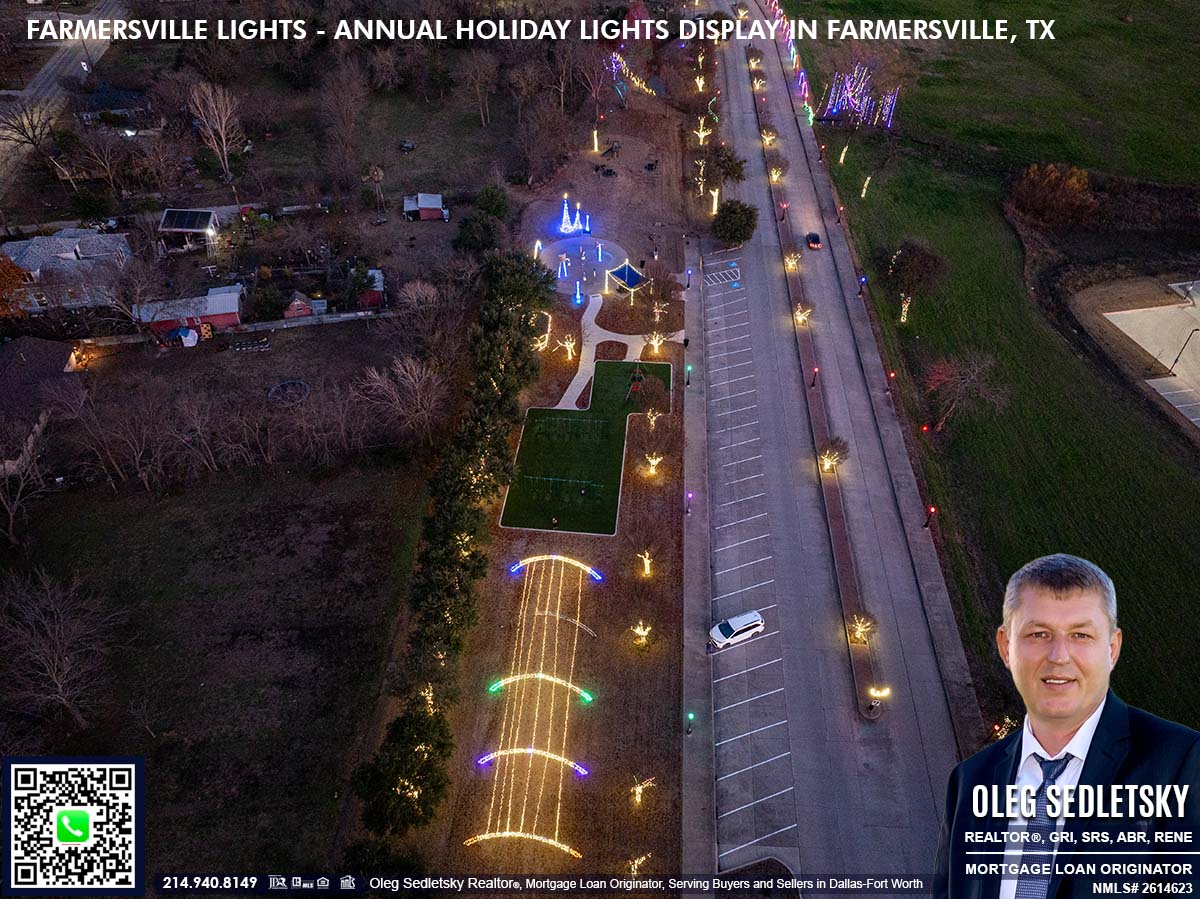
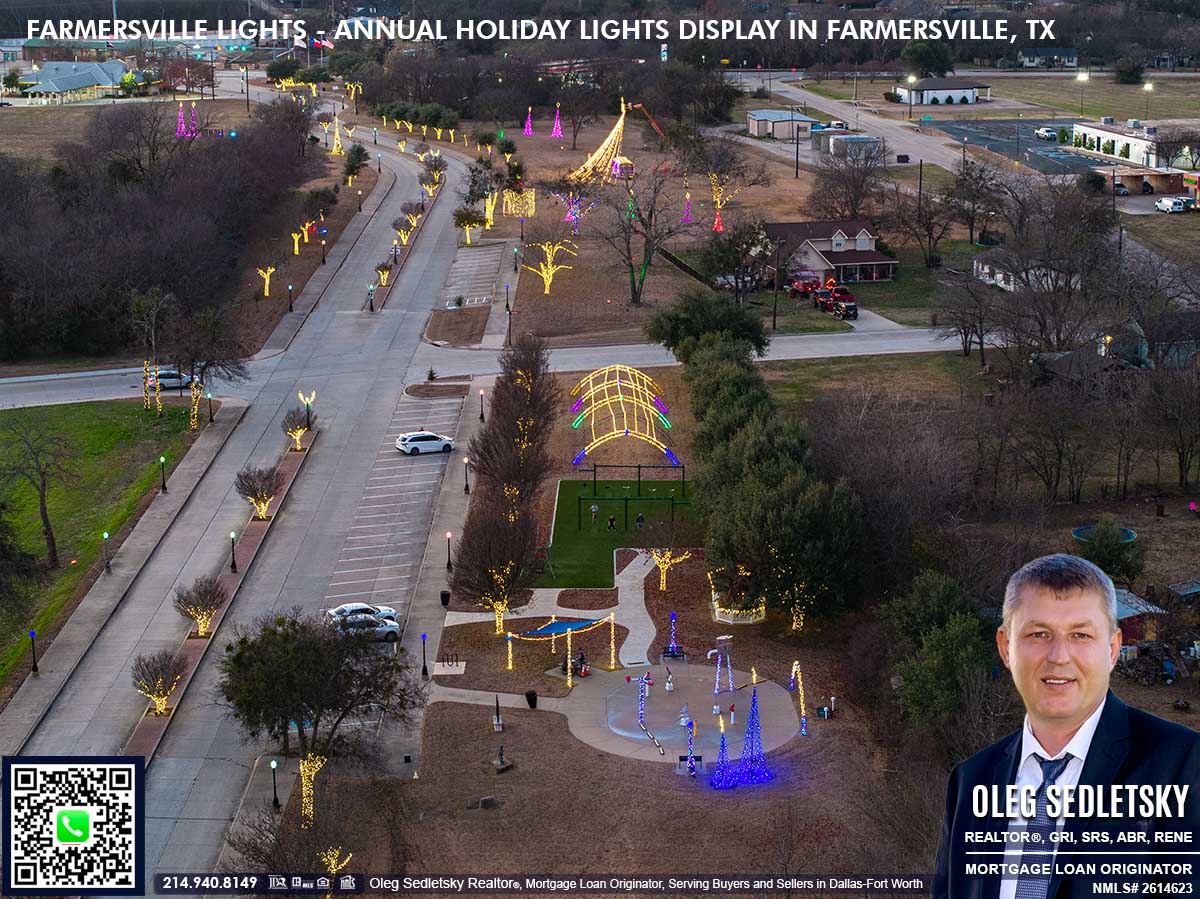
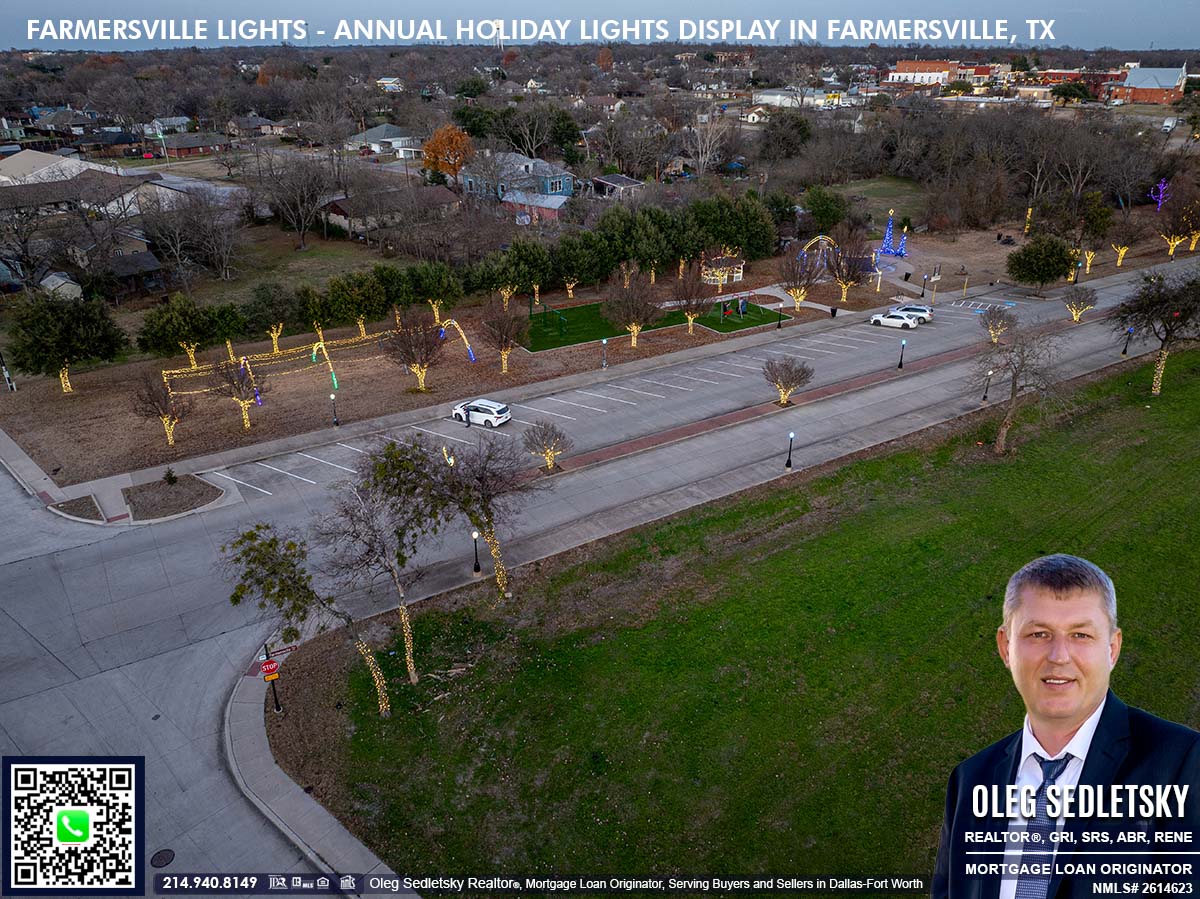
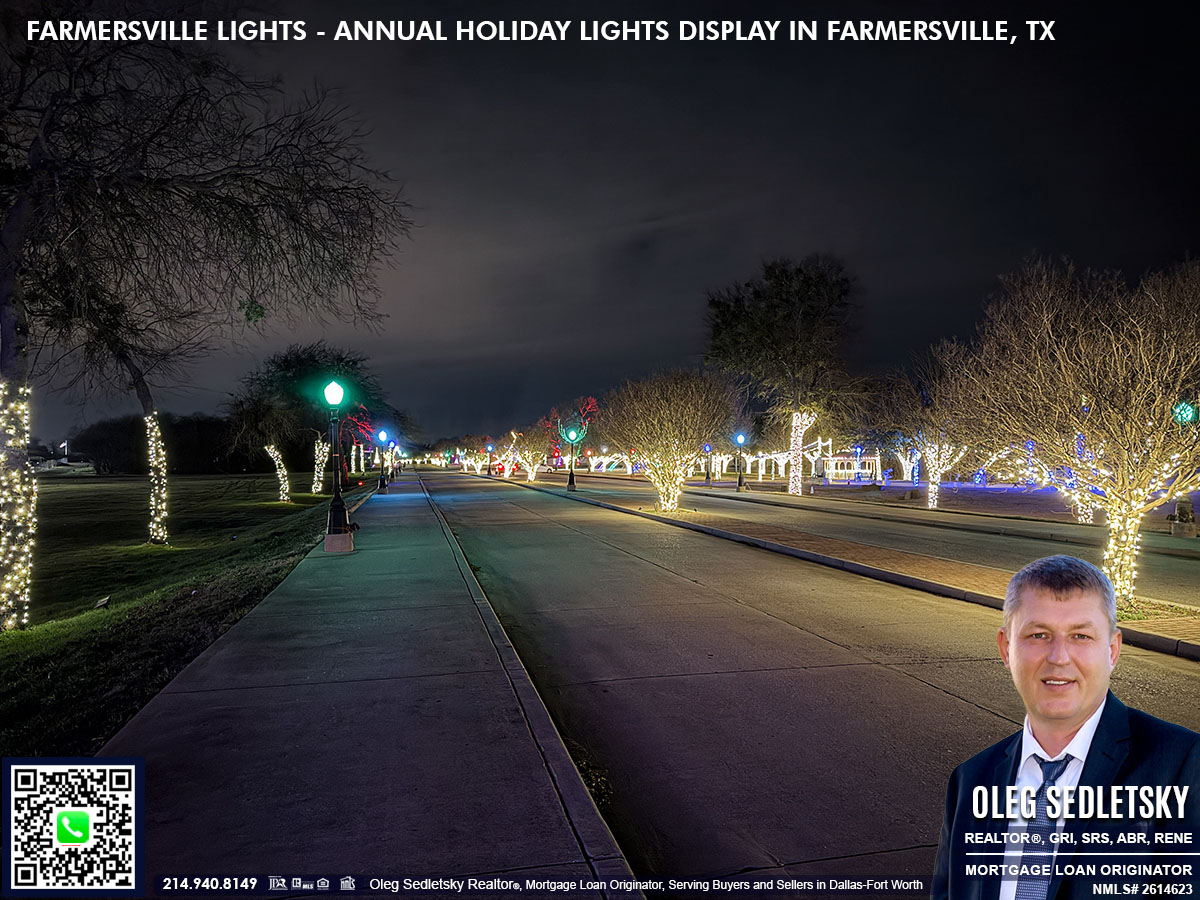
The Farmersville Lights display runs for nearly a mile along Farmersville Parkway, from the city entrance sign on Highway 78 to the historic Onion Shed on Main Street. You can drive it, but I decided to walk the route, and I am so glad I did. It was so fascinating that after walking the entire path for 20 minutes, I turned around and did it all over again just to soak it all in.


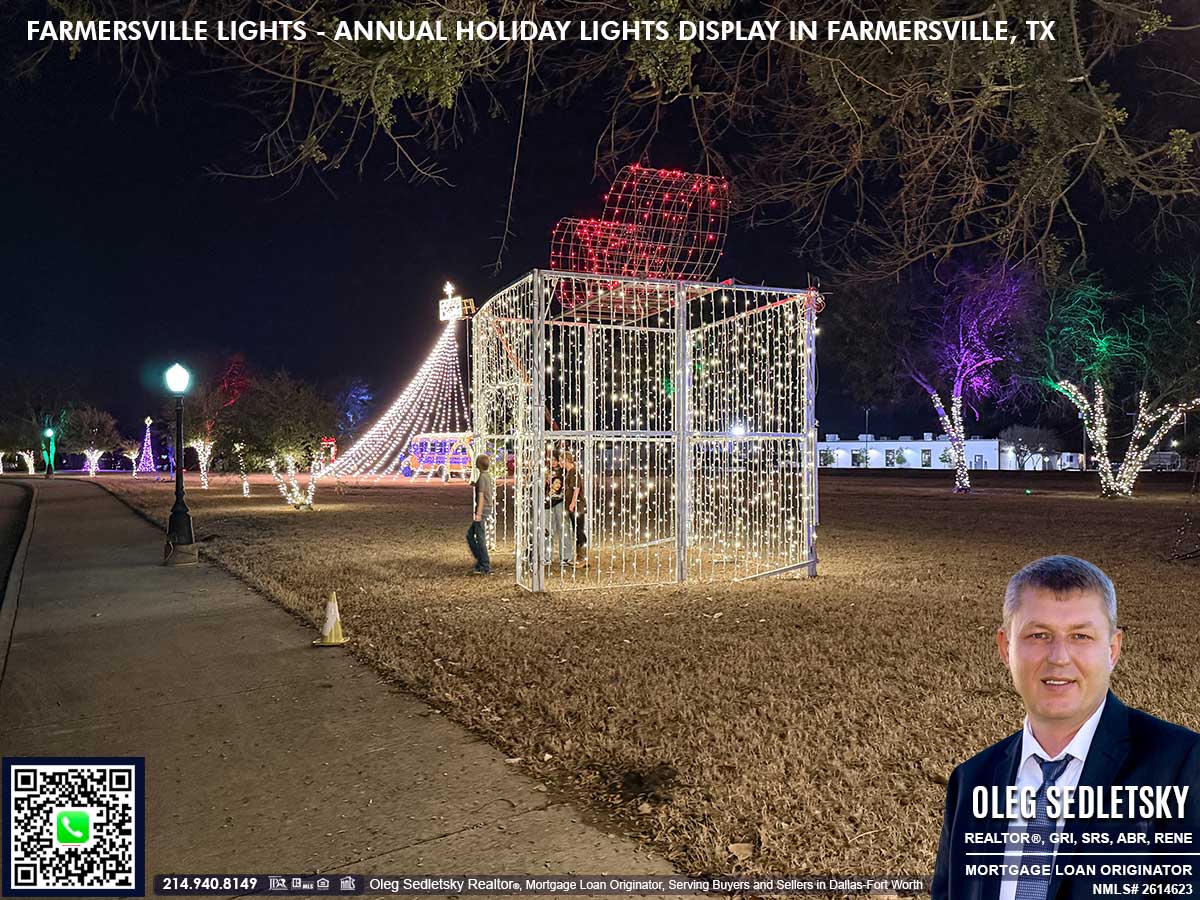
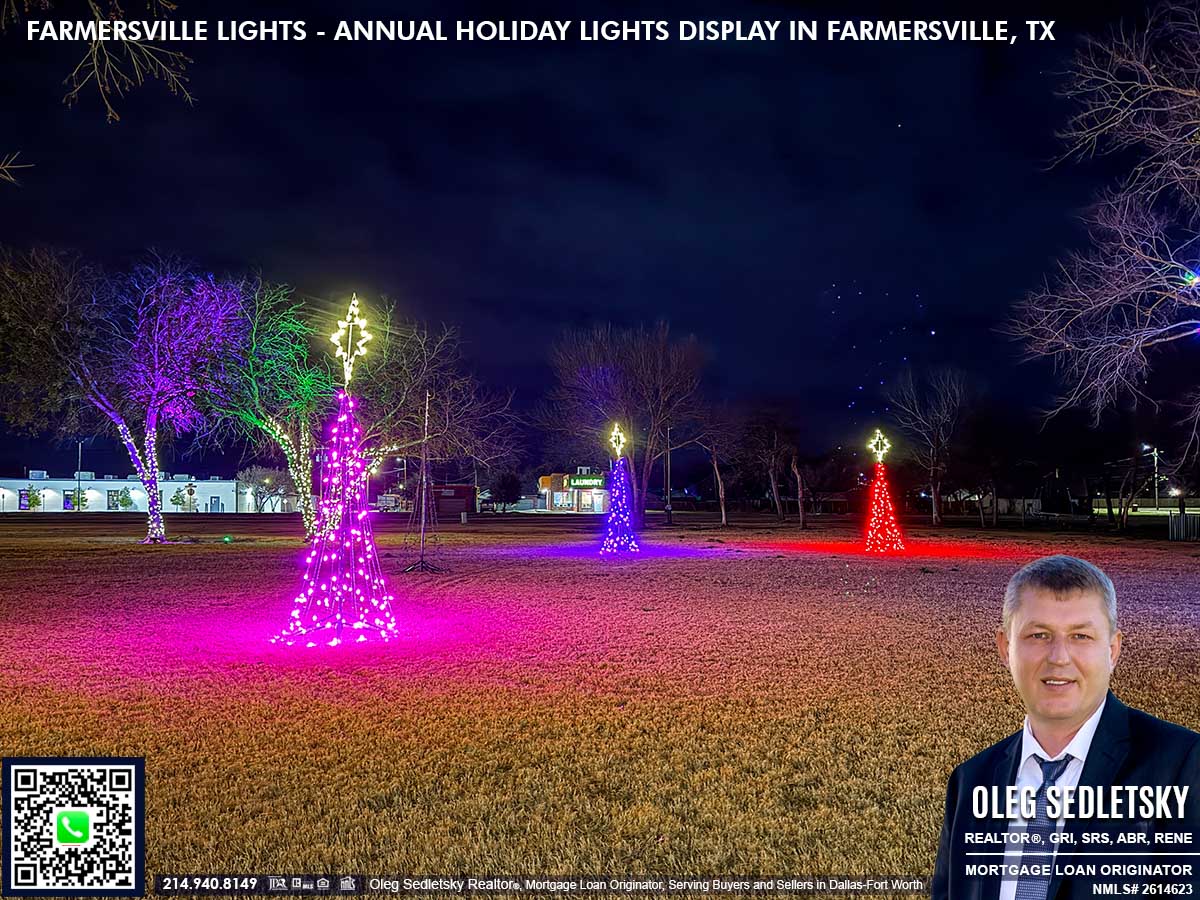
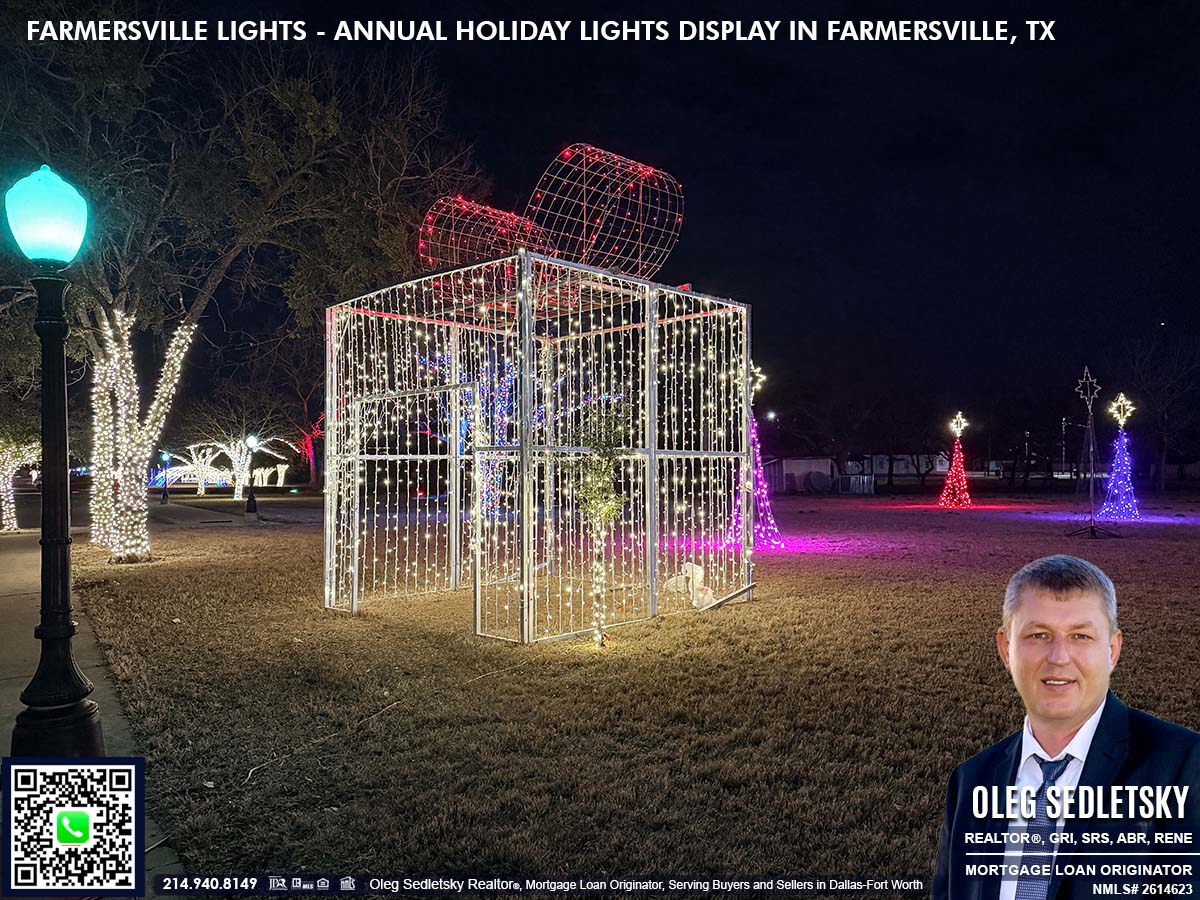
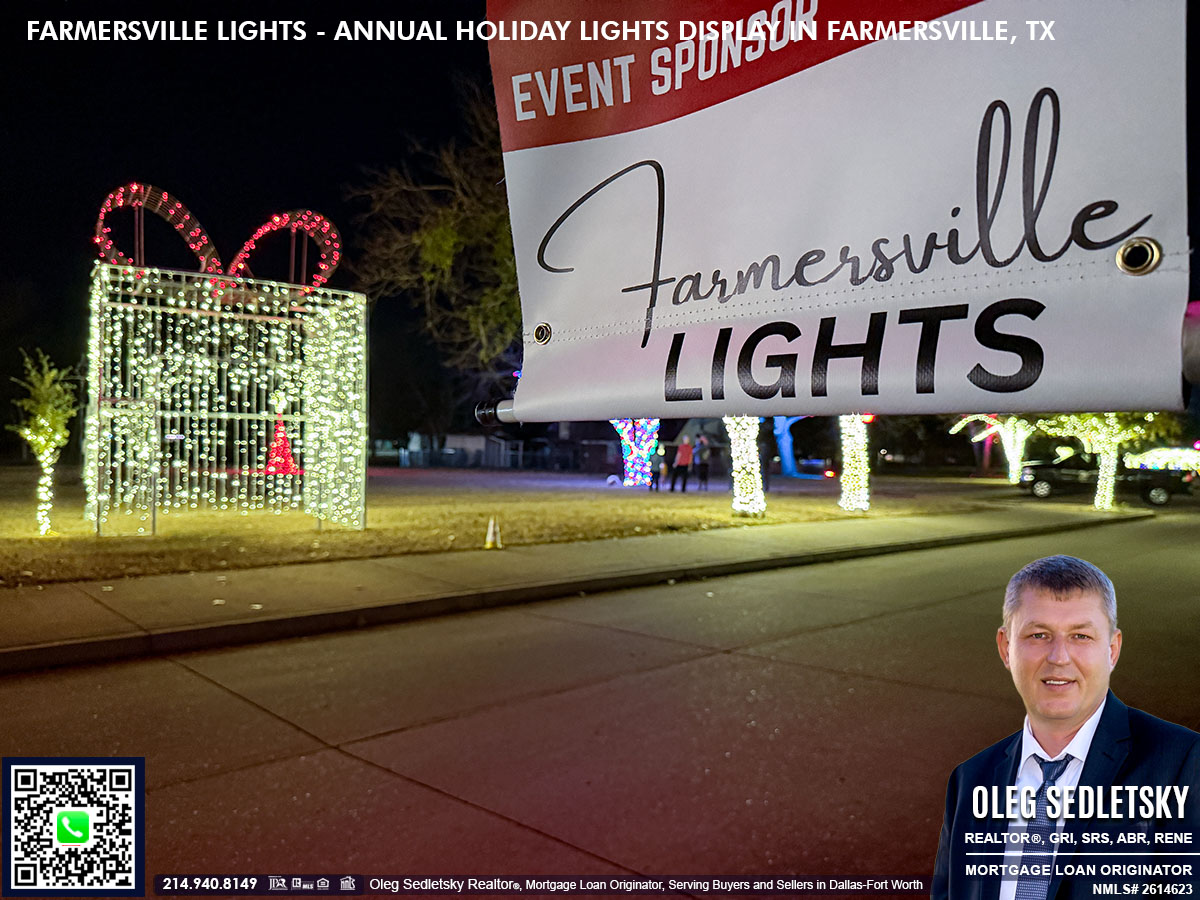
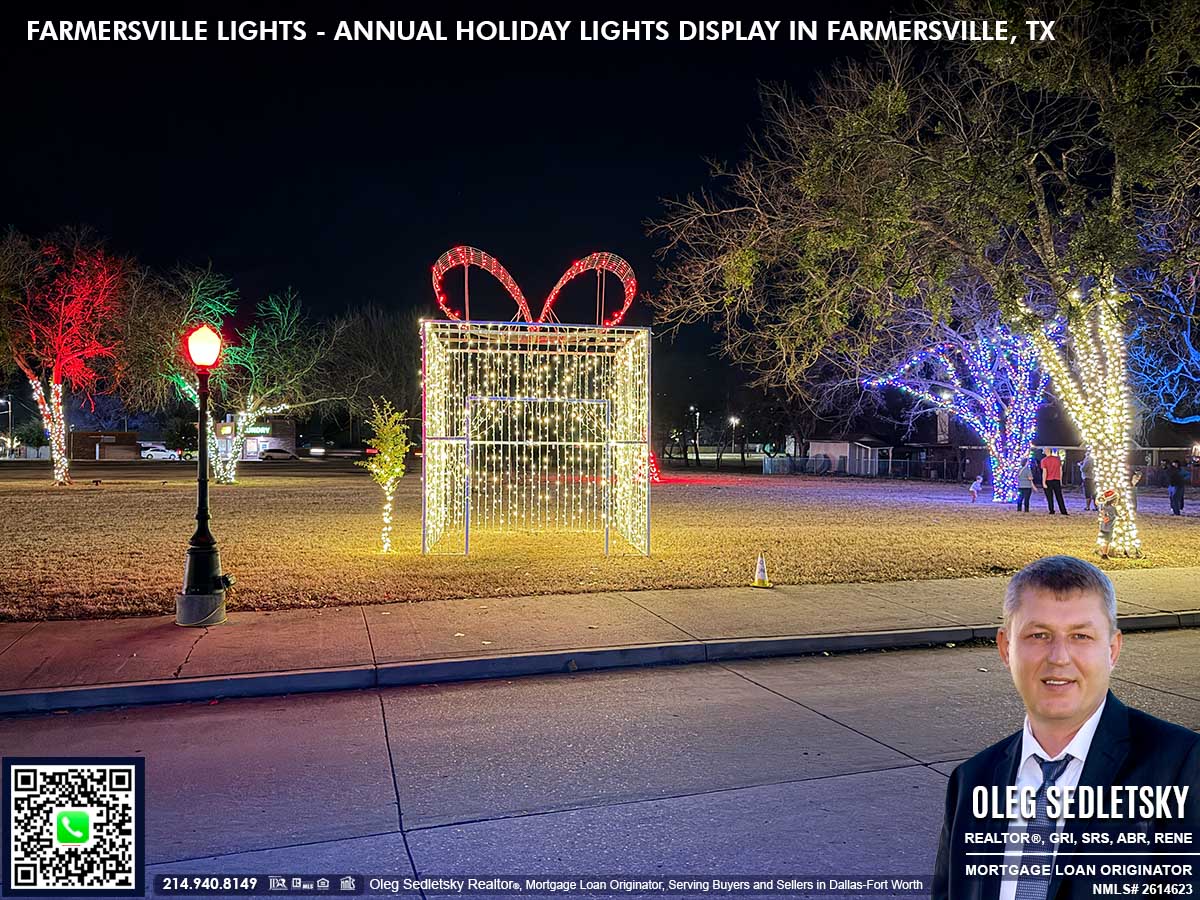
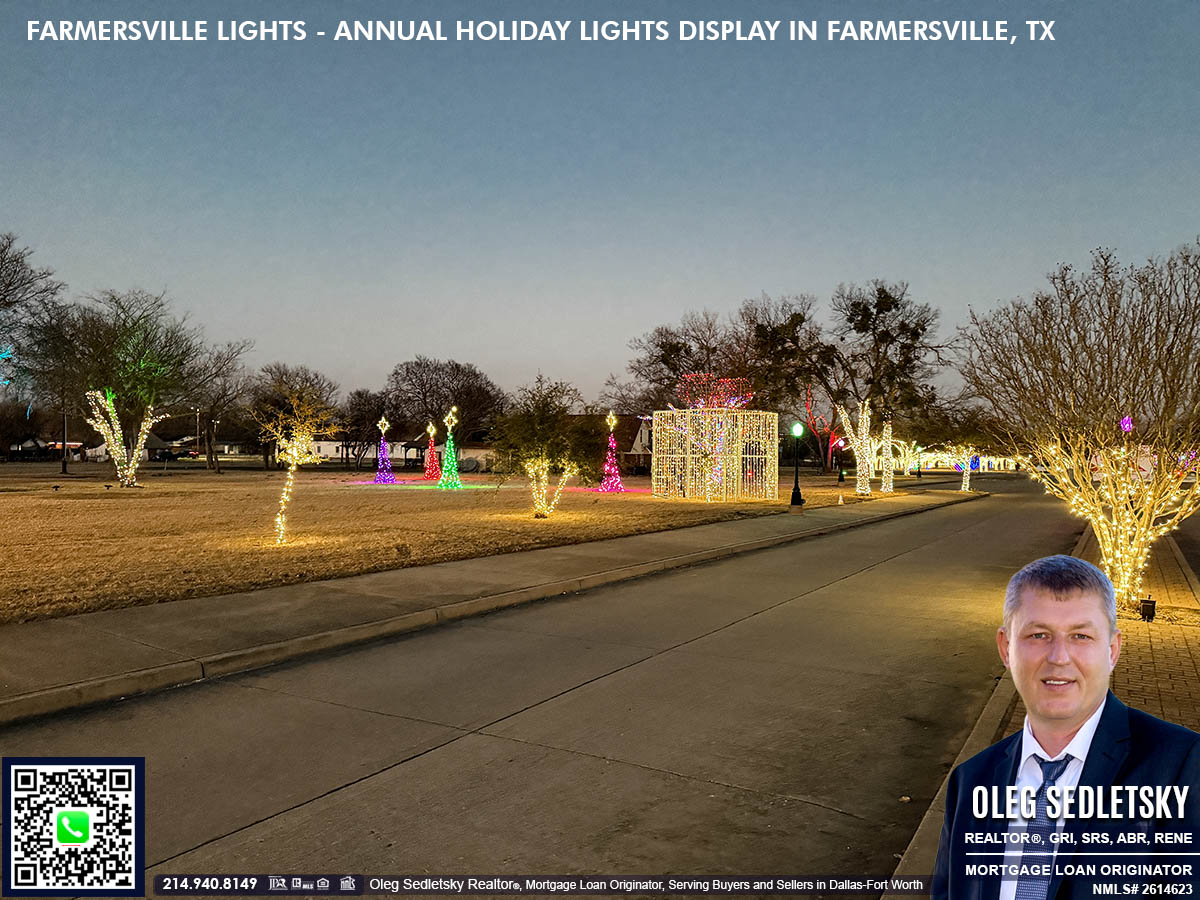
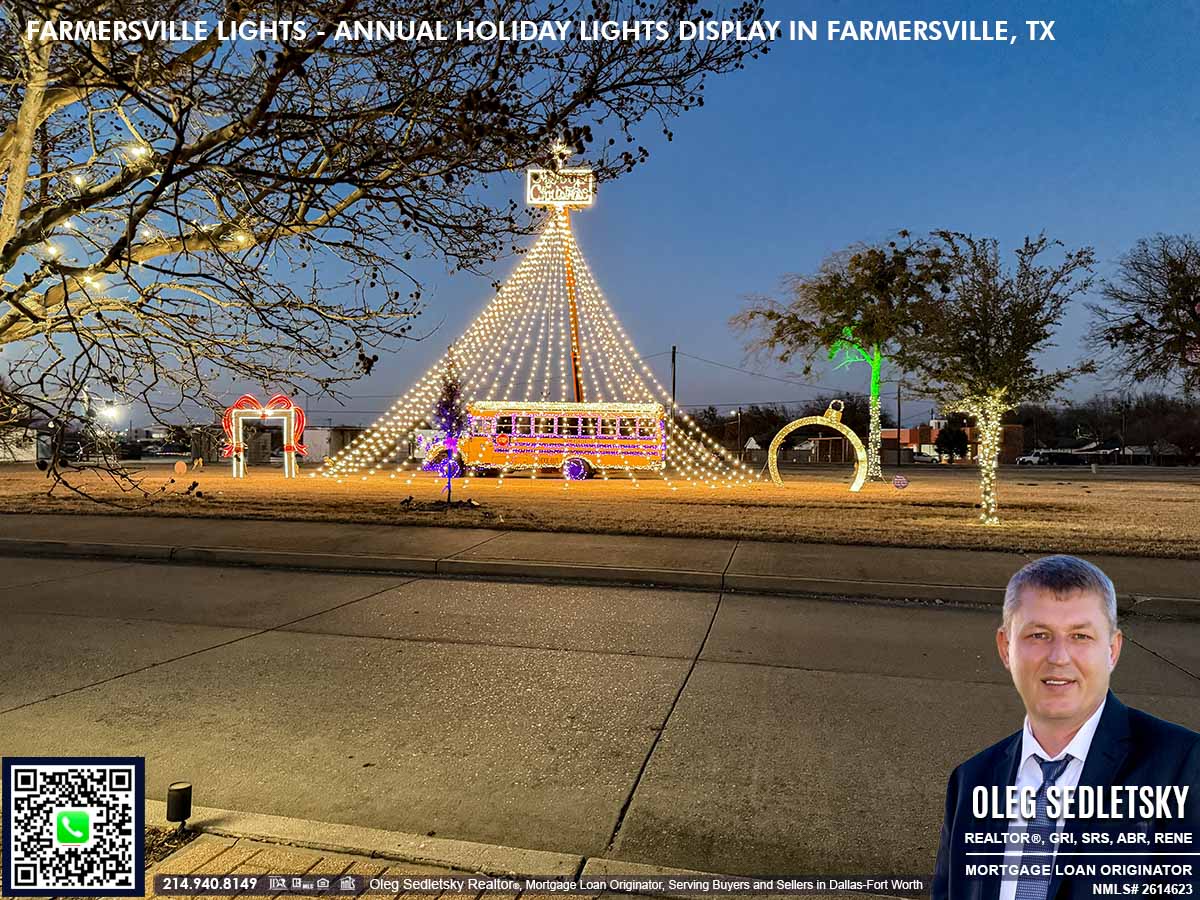
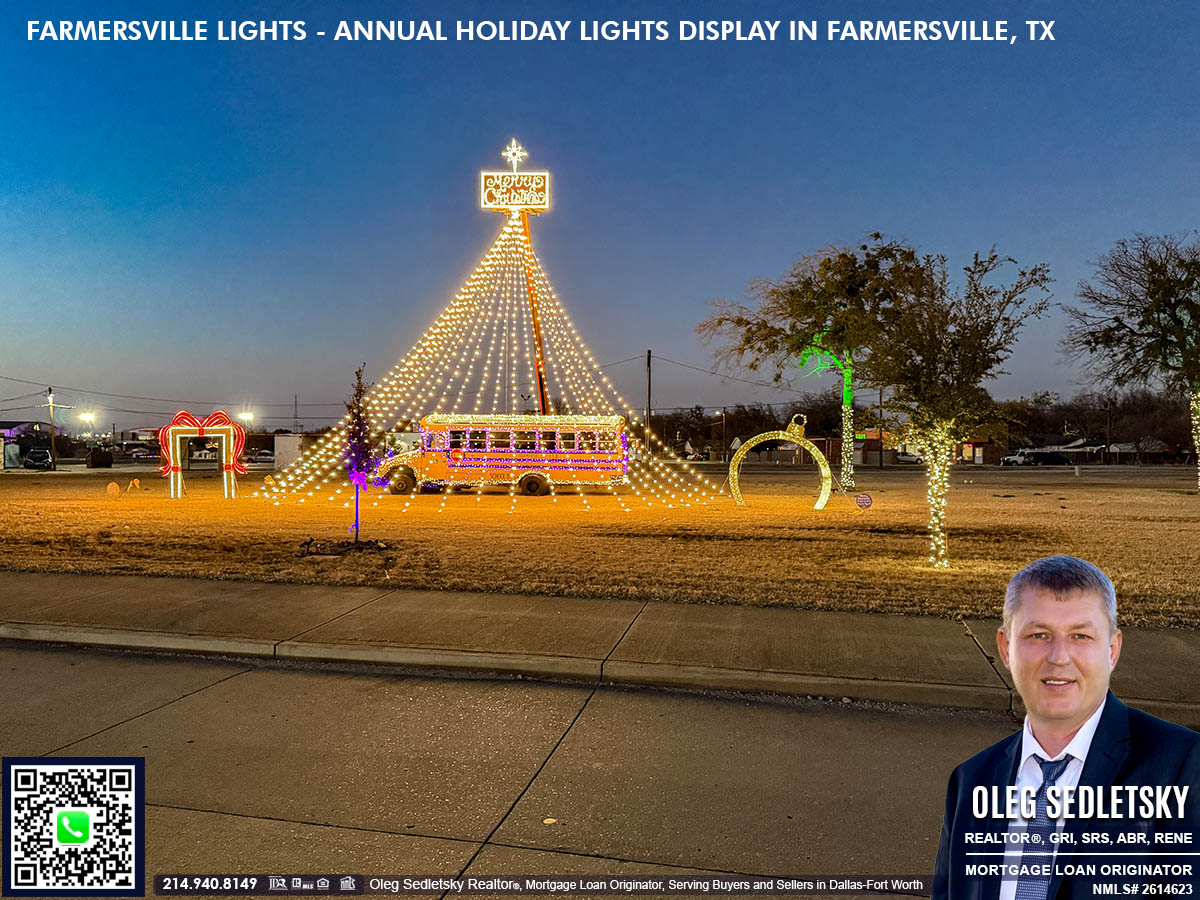
The Christmas Tree Waterfall
One of the first sights that captures your attention is the Christmas Tree Waterfall. This is not your typical tree. It is a massive structure made of cascading string lights that creates the illusion of a giant, glowing tree. A brightly lit school bus sits at its base, along with other decorations that look like presents. The real showstopper, though, is a 12×12 foot gift box you can actually walk inside. It is an original and fun attraction that had everyone excited, taking pictures and making memories.

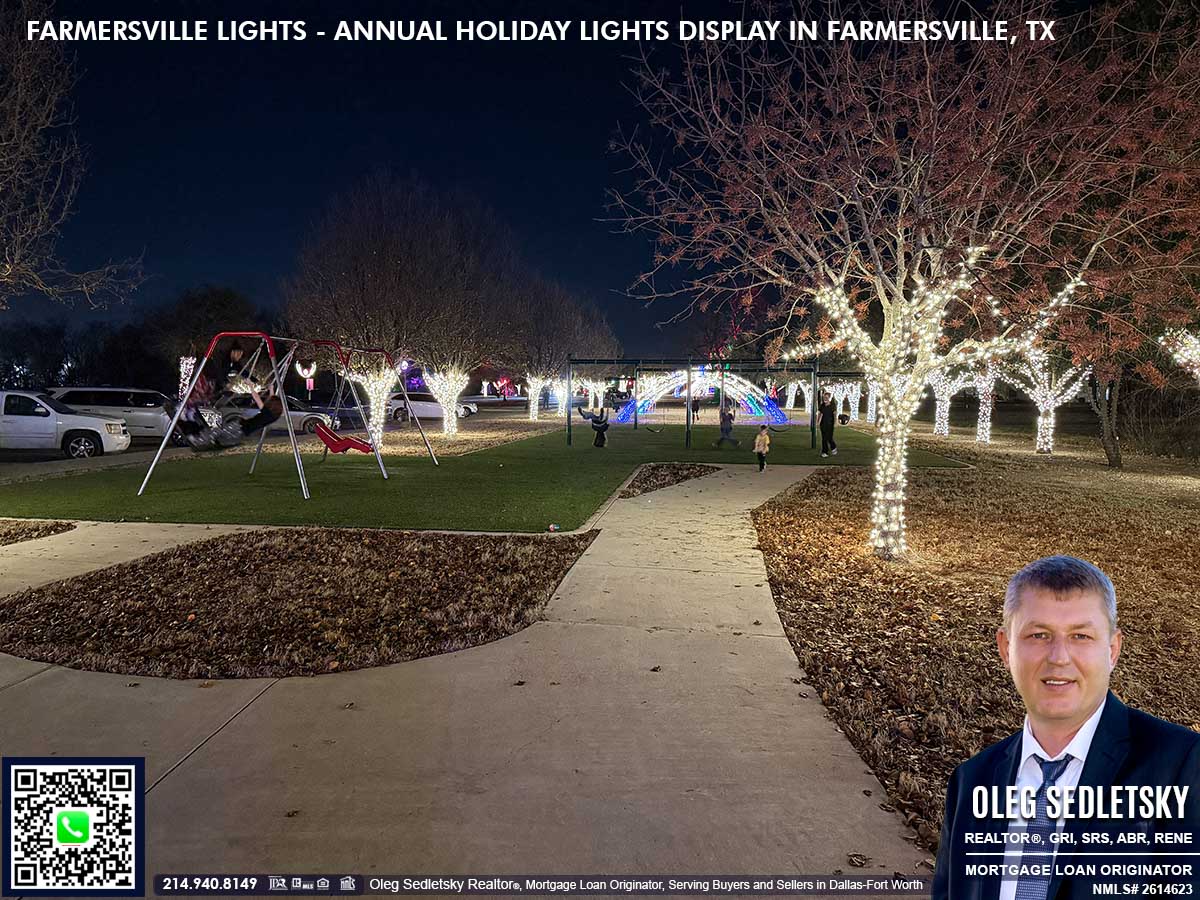
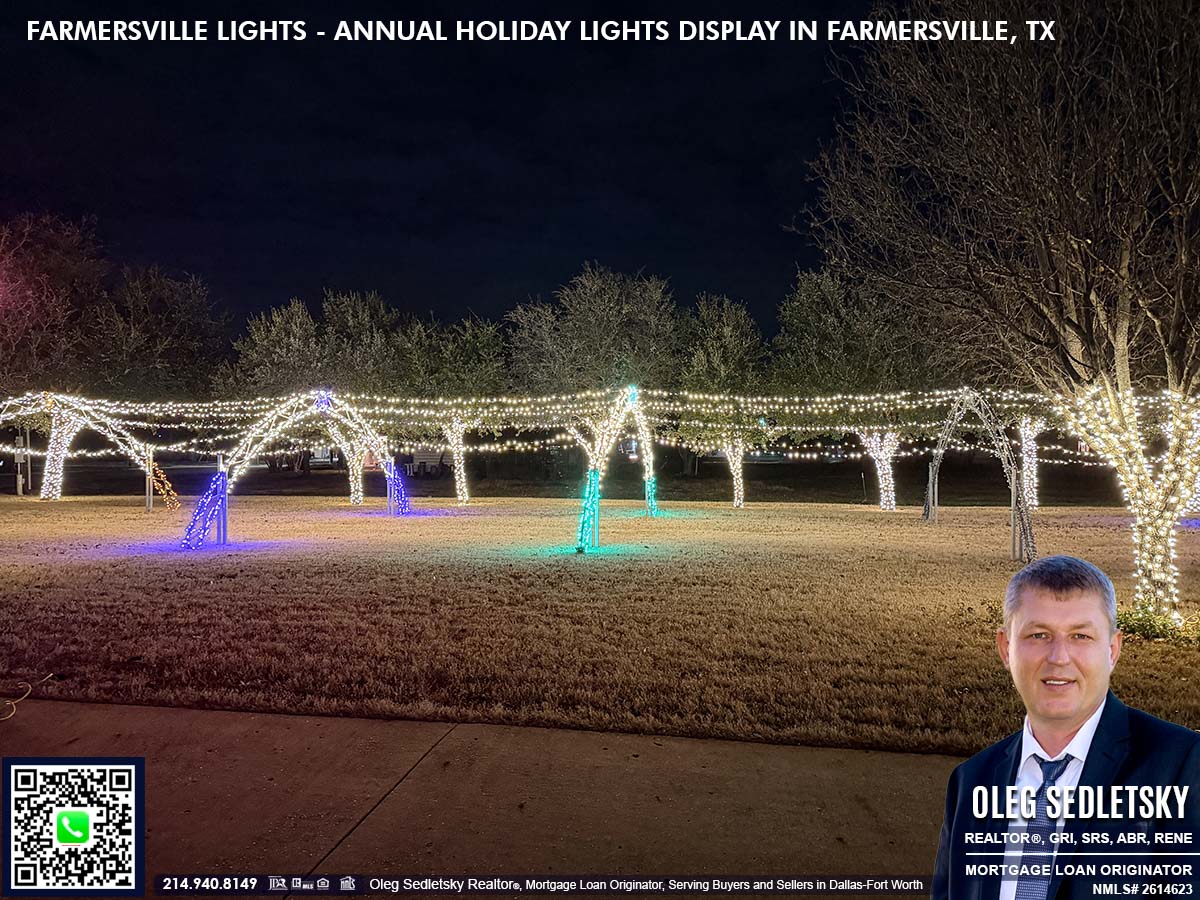
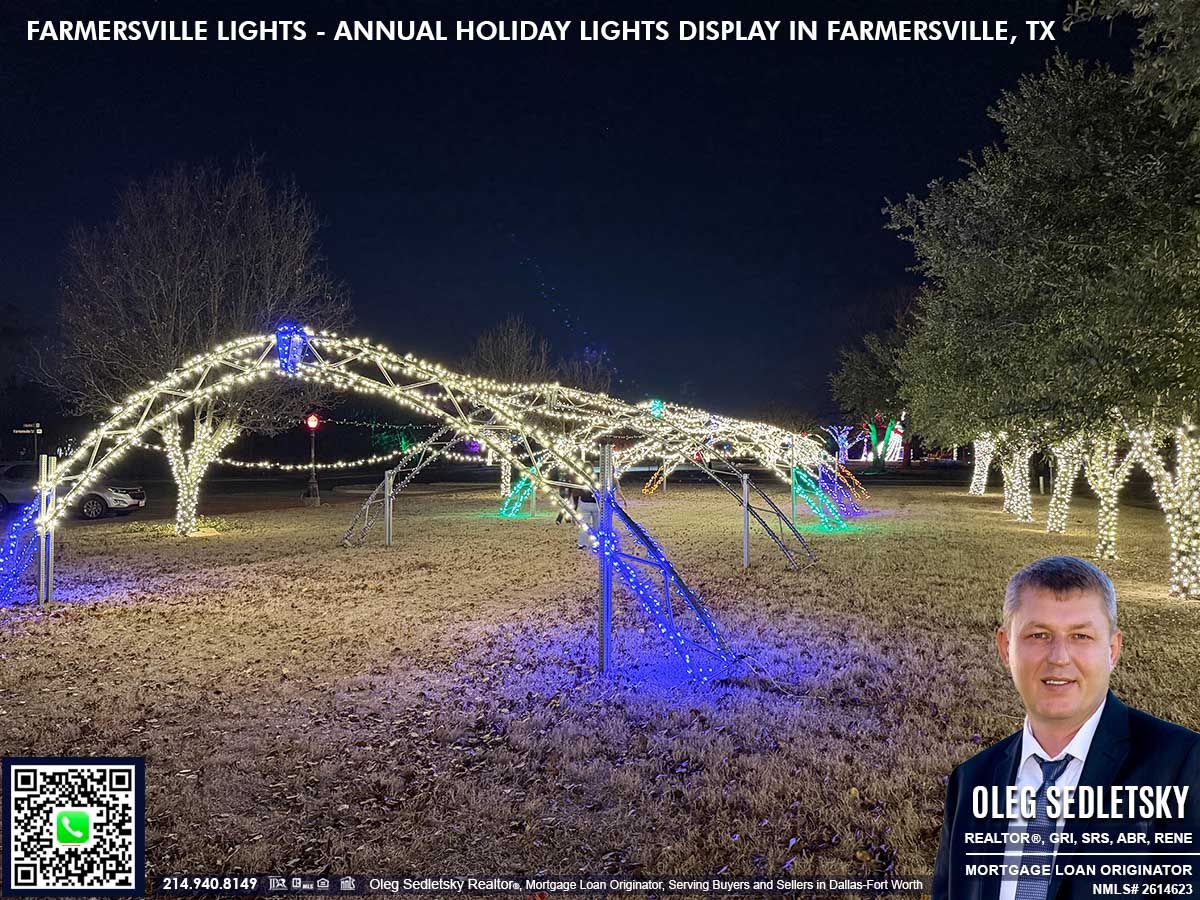
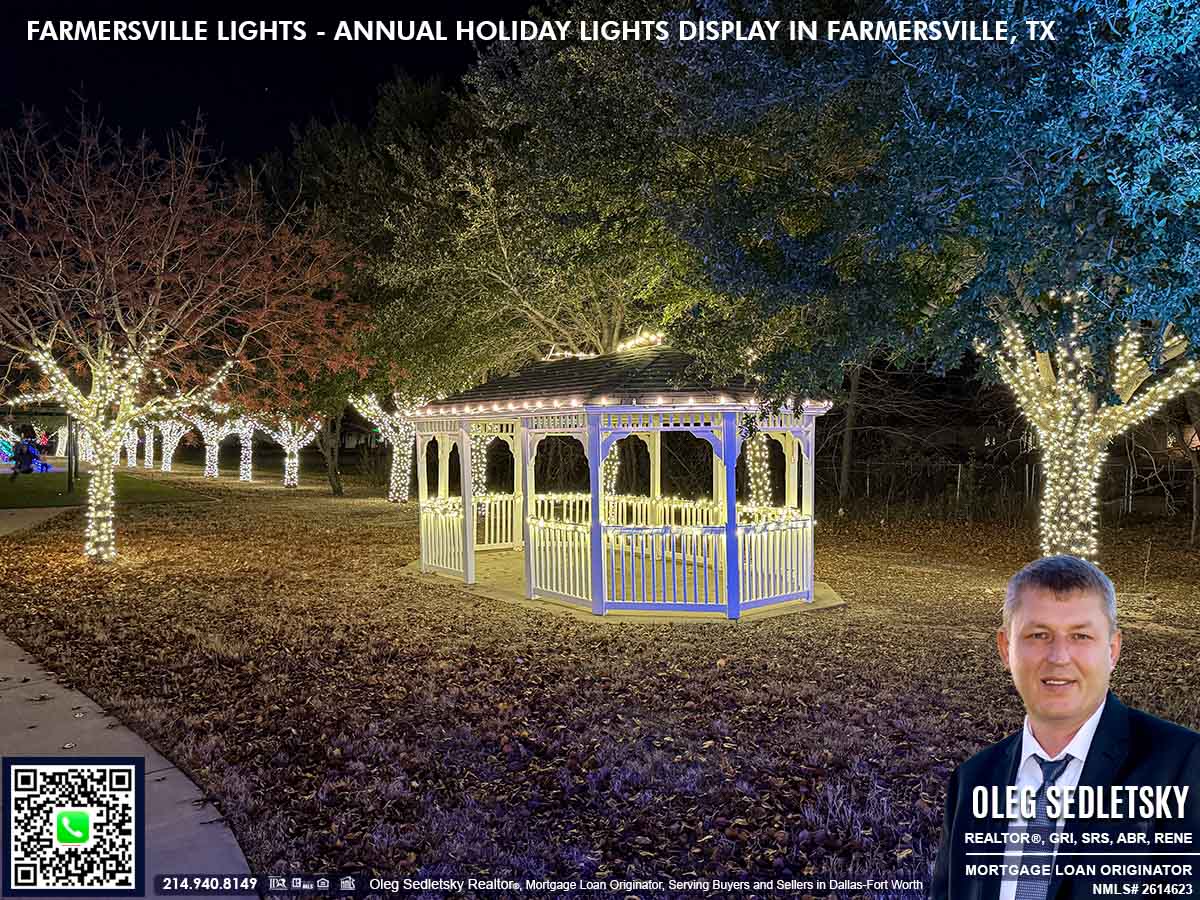
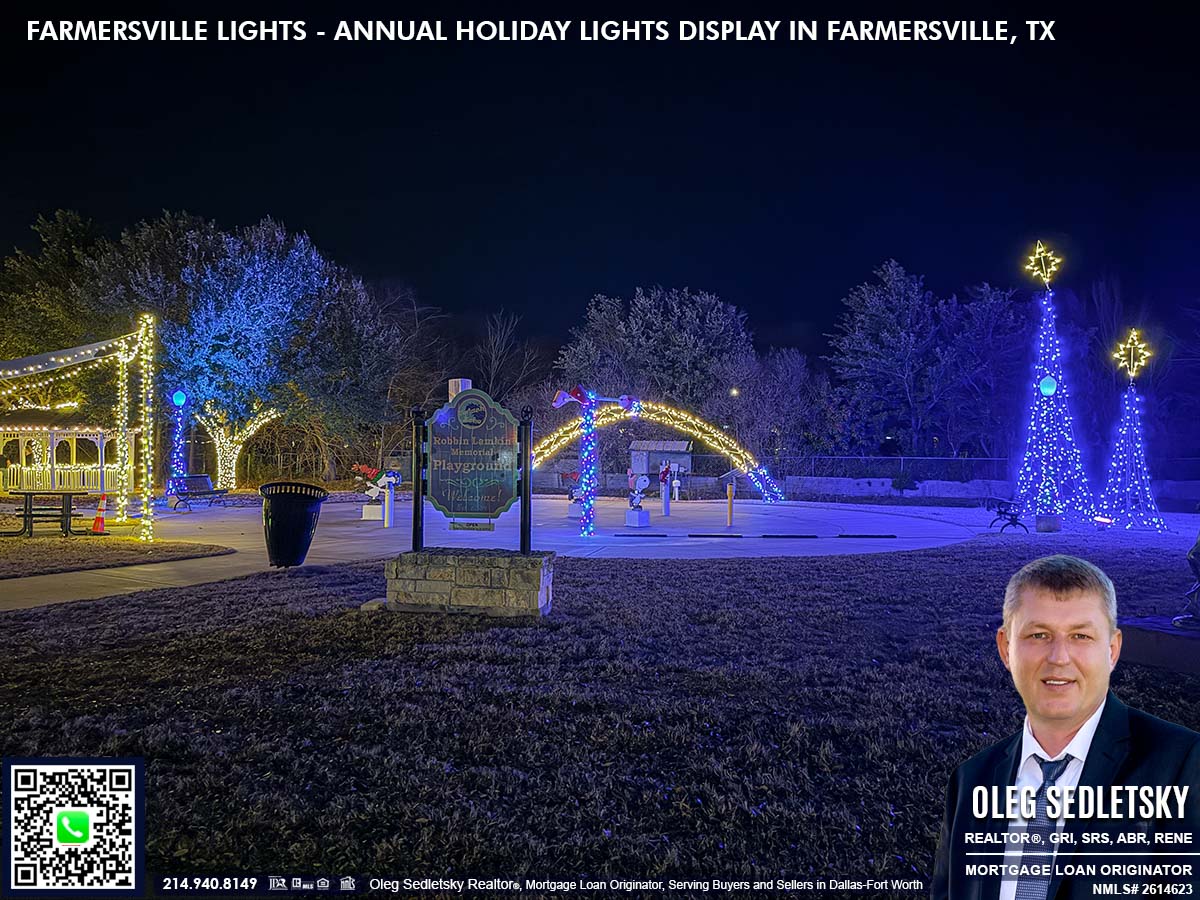
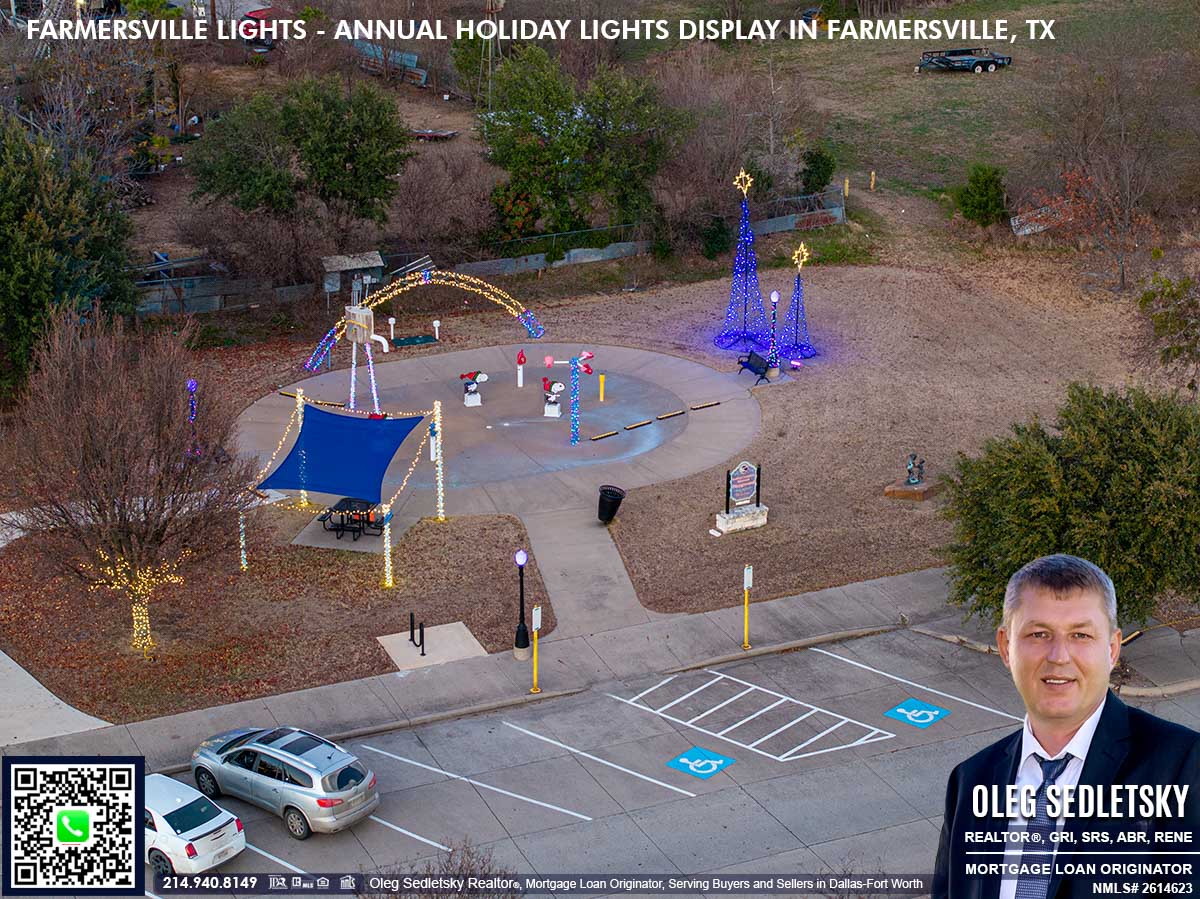
Whimsy Near the Robbin Lamkin Memorial Splash Pad
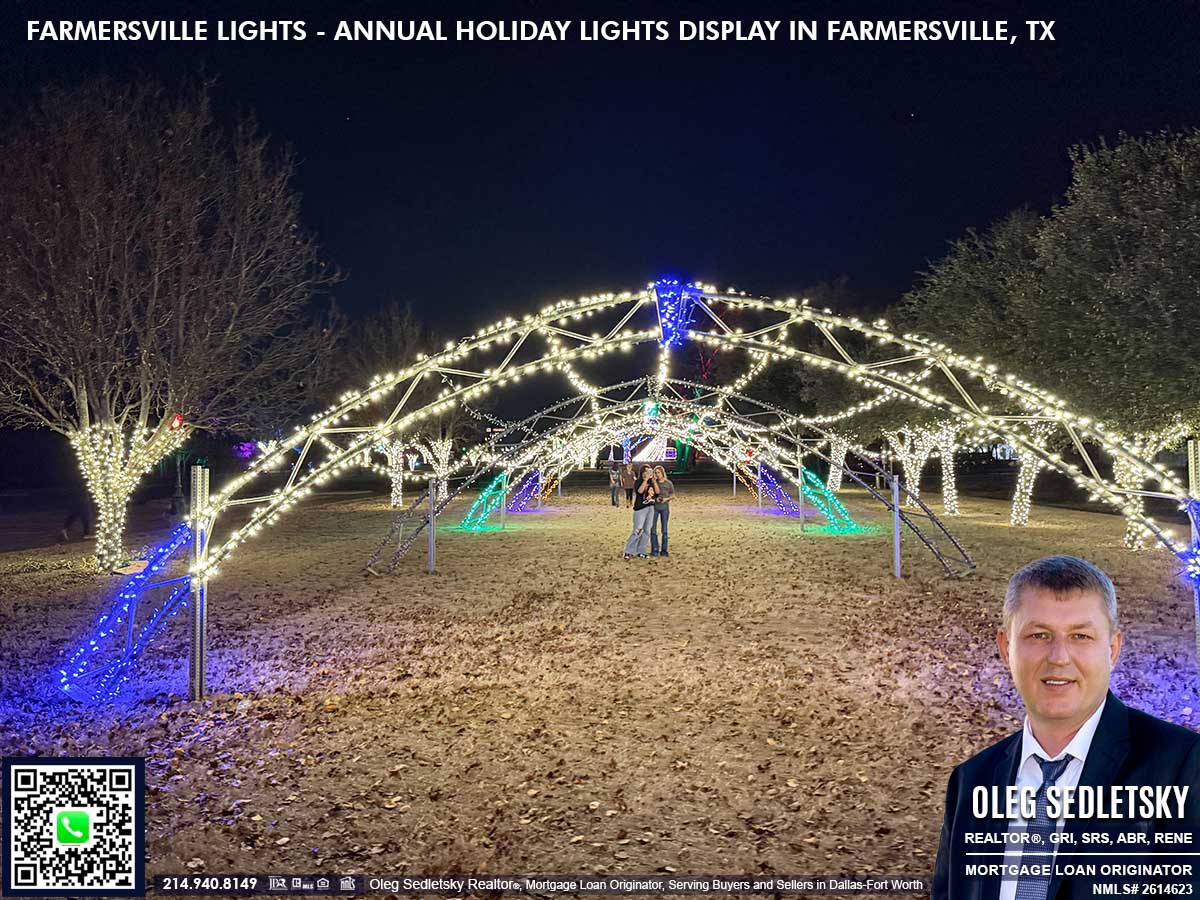
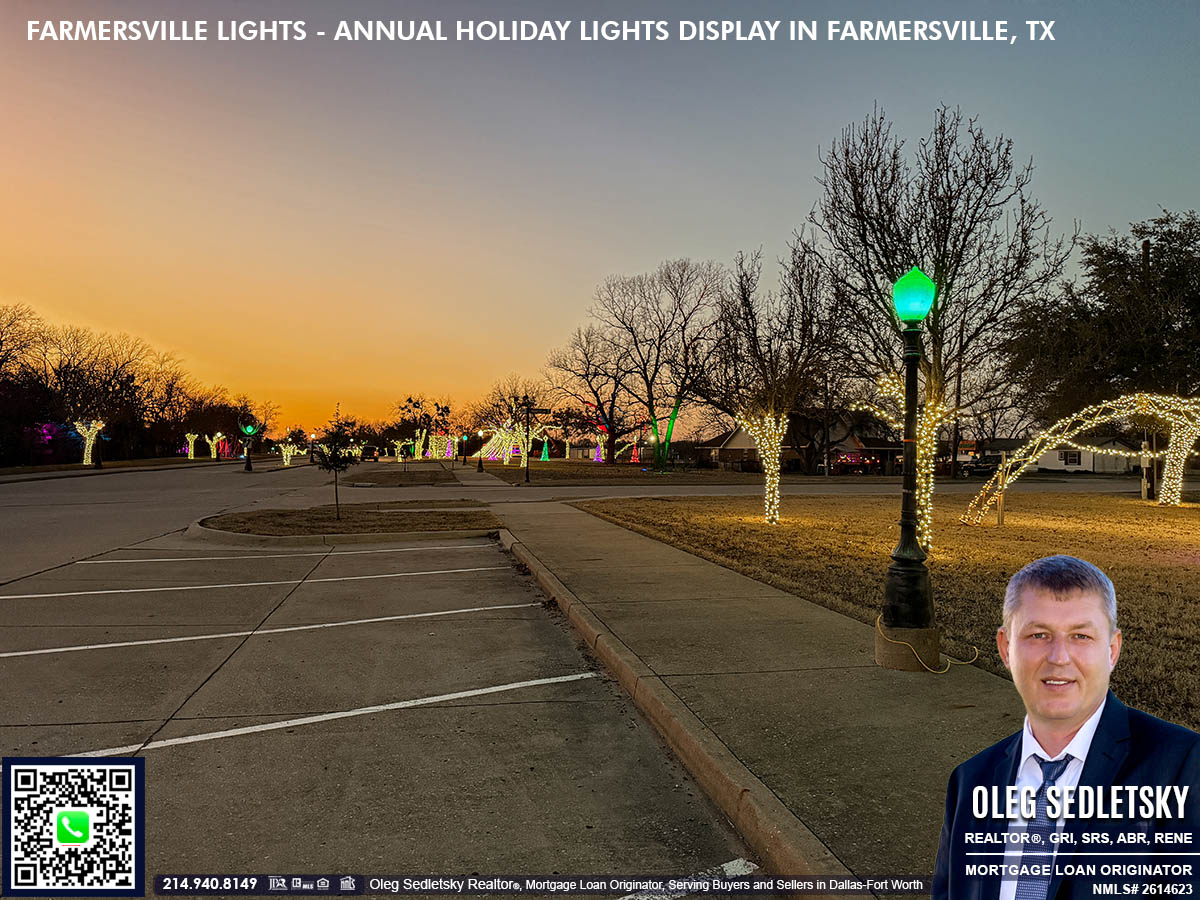
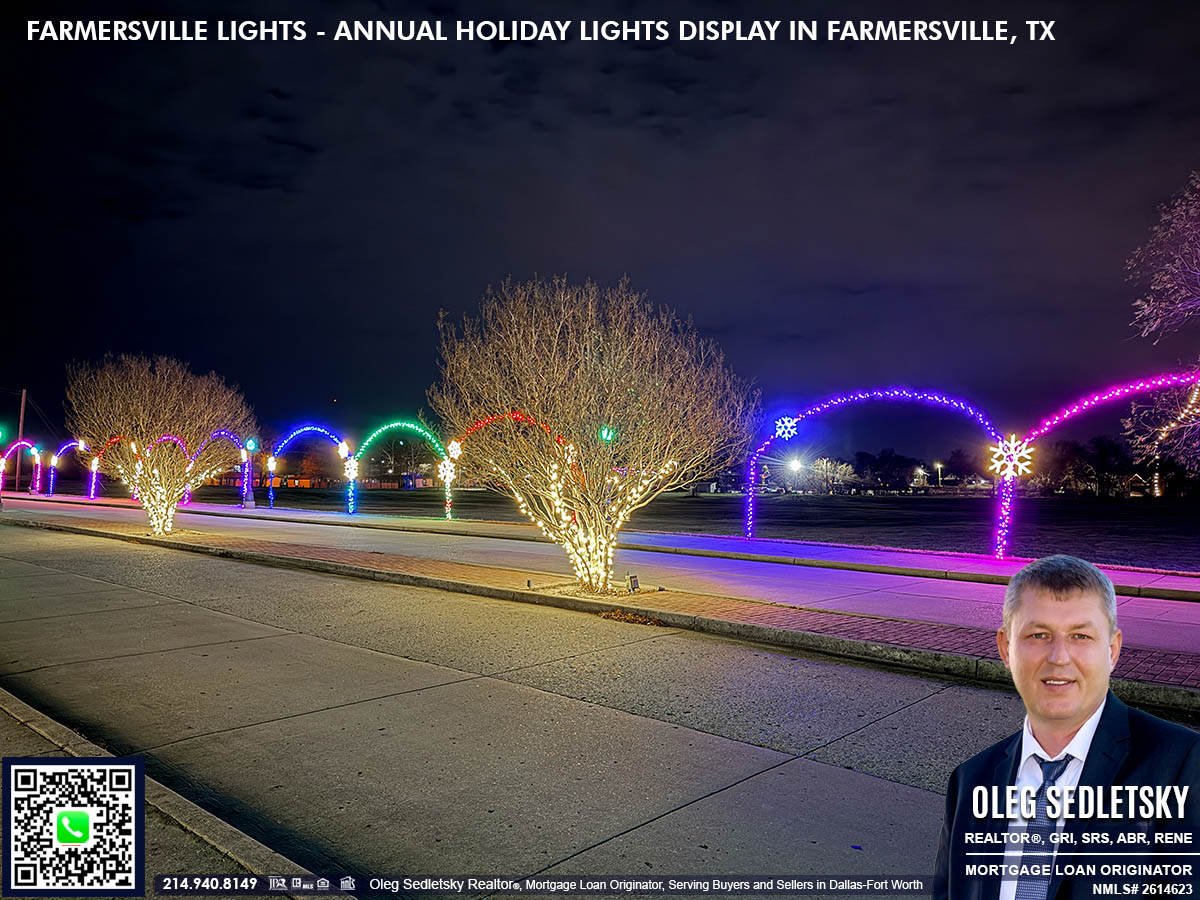
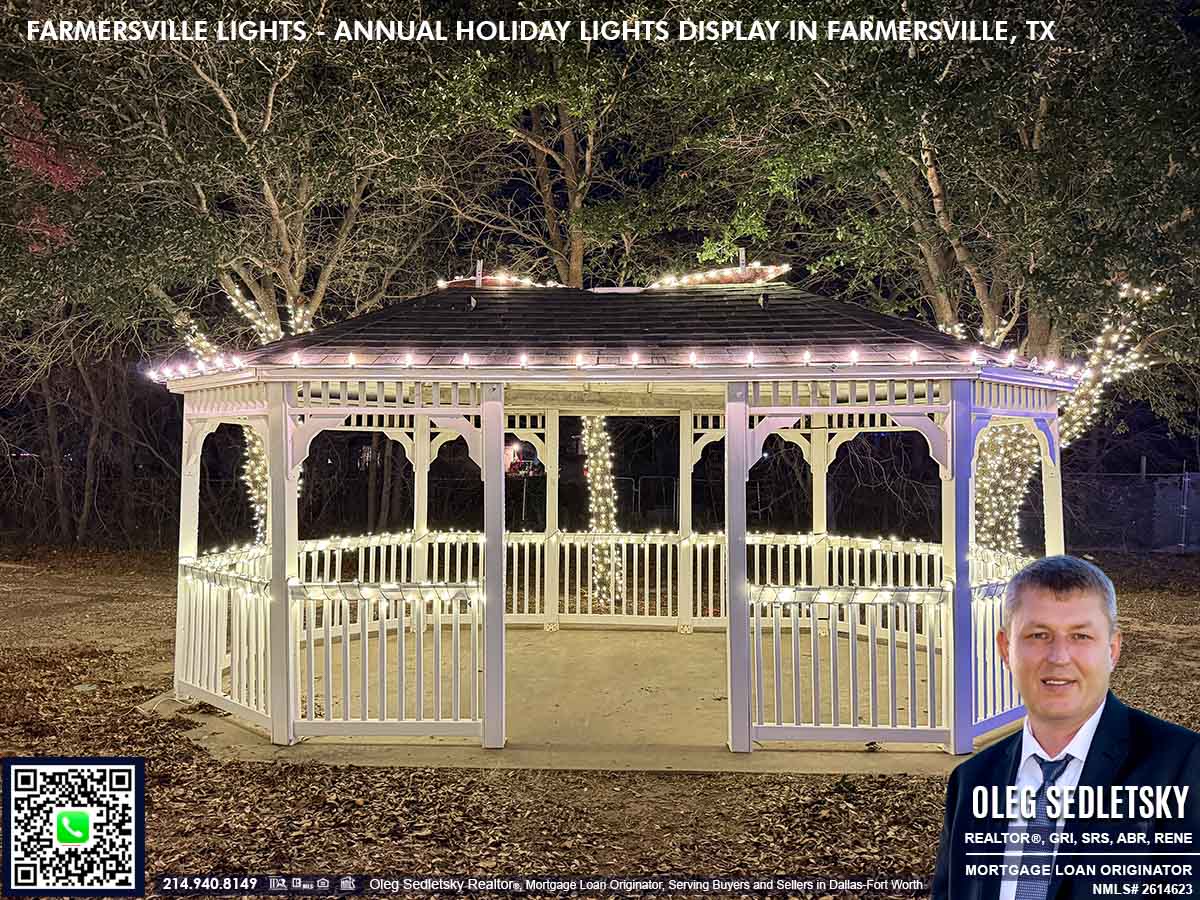
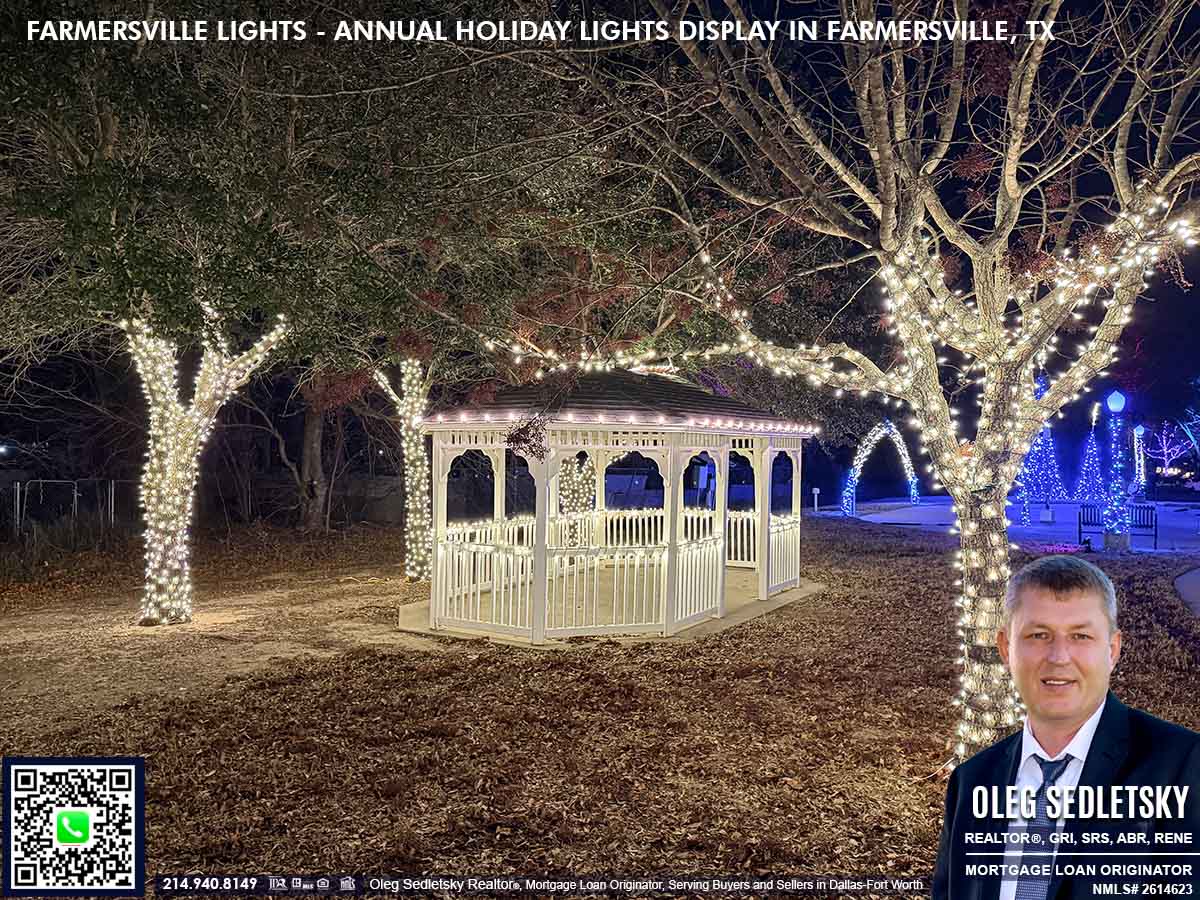
Right next to the Robbin Lamkin Memorial Splash Pad, you’ll find an inviting tunnel of light arches that creates a glowing pathway. This eye-catching tunnel stands out as its own display, immediately drawing families in for strolls and photo opportunities.
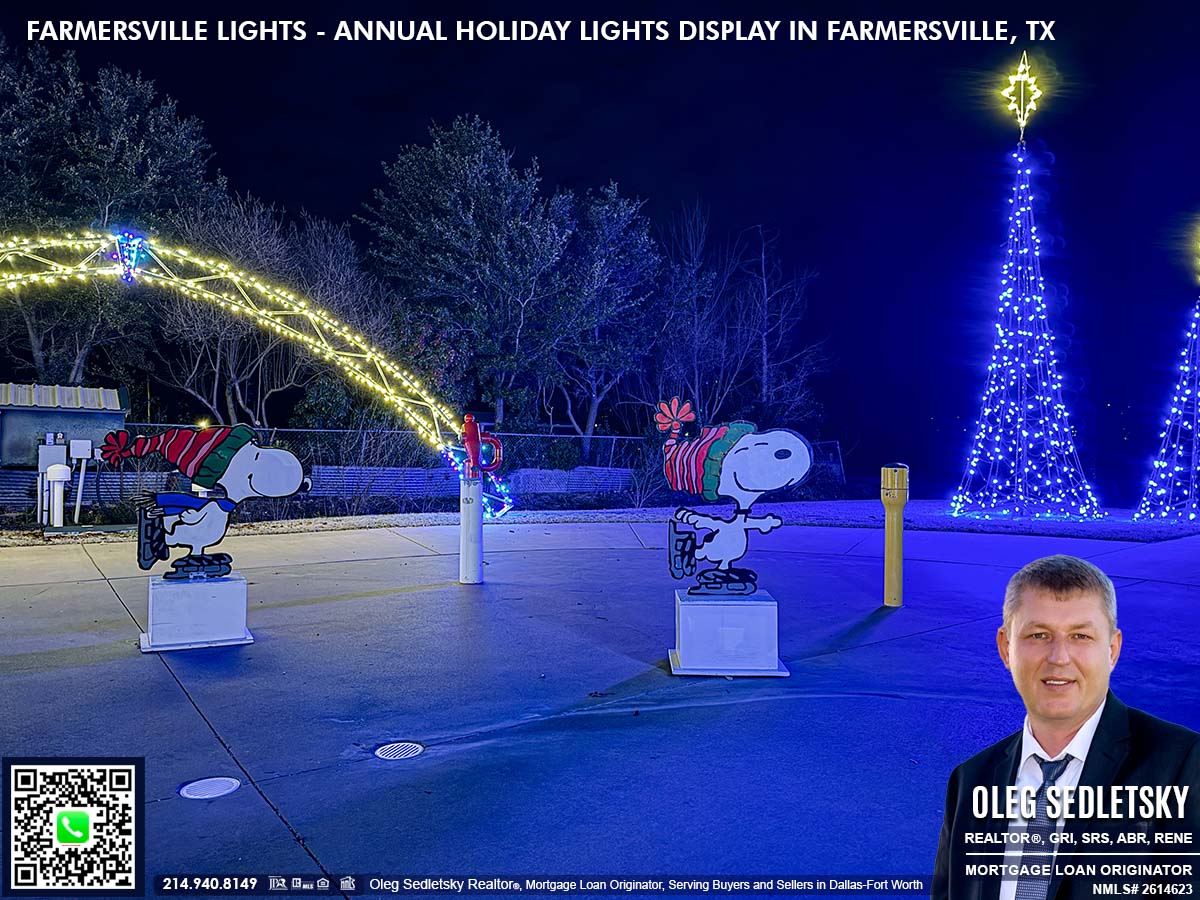
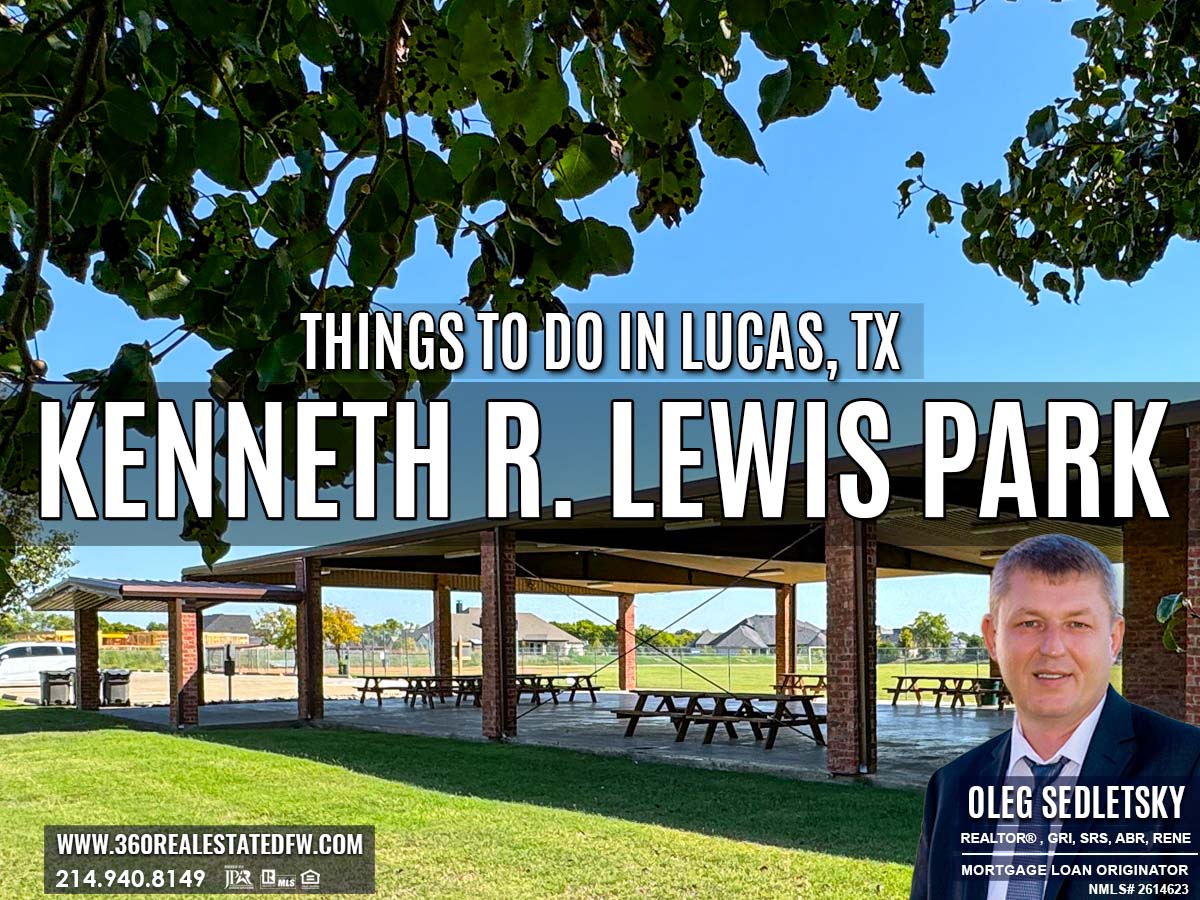
The festive journey continues as you step into the actual splash pad area. Here, a cheerful Snoopy scene greets you beside the play features, while the pavilion and shaded picnic table are wrapped with sparkling lights. The whole space is transformed into a cozy, illuminated nook, perfect for gathering with family or taking a break from the excitement. If you want to learn more about this local park during other times of the year, I have a dedicated article about the Robbin Lamkin Memorial Splash Pad you might enjoy.

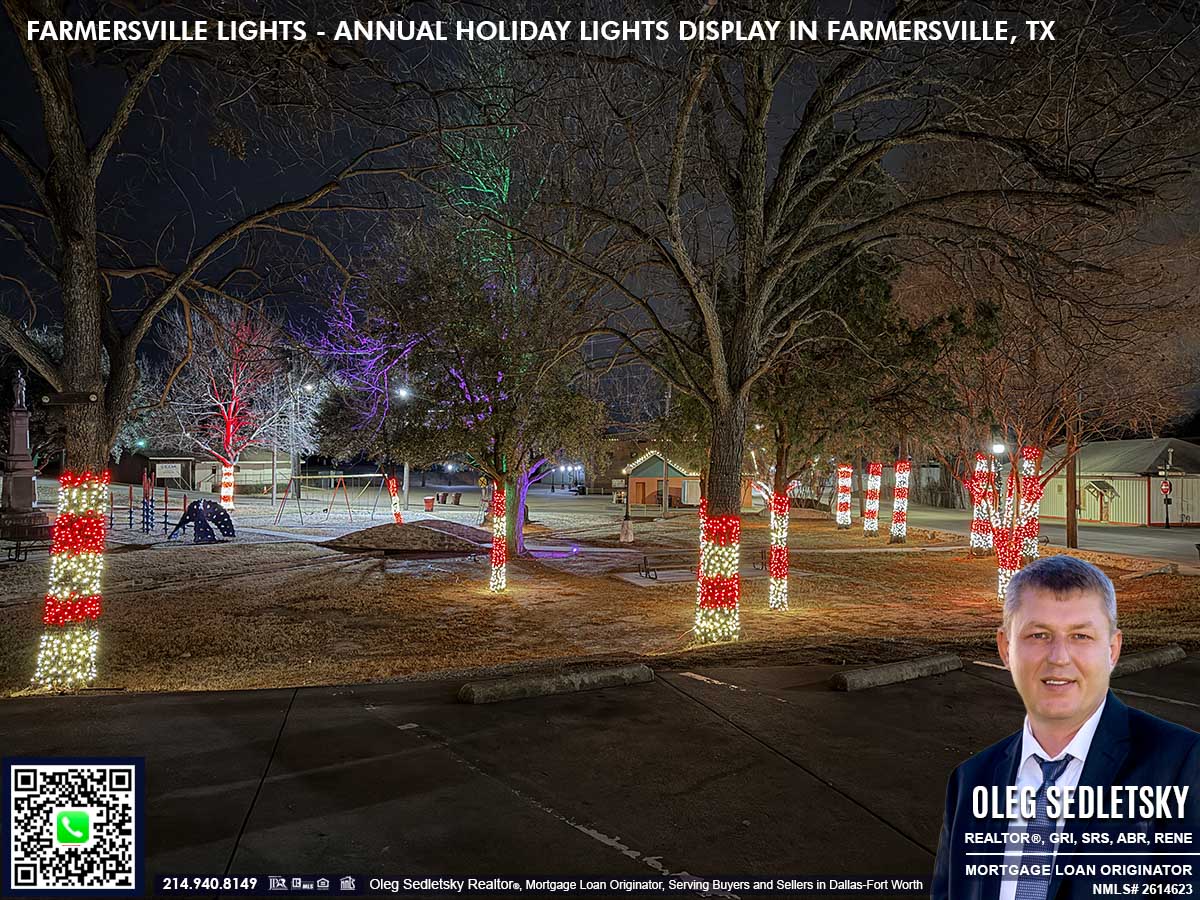
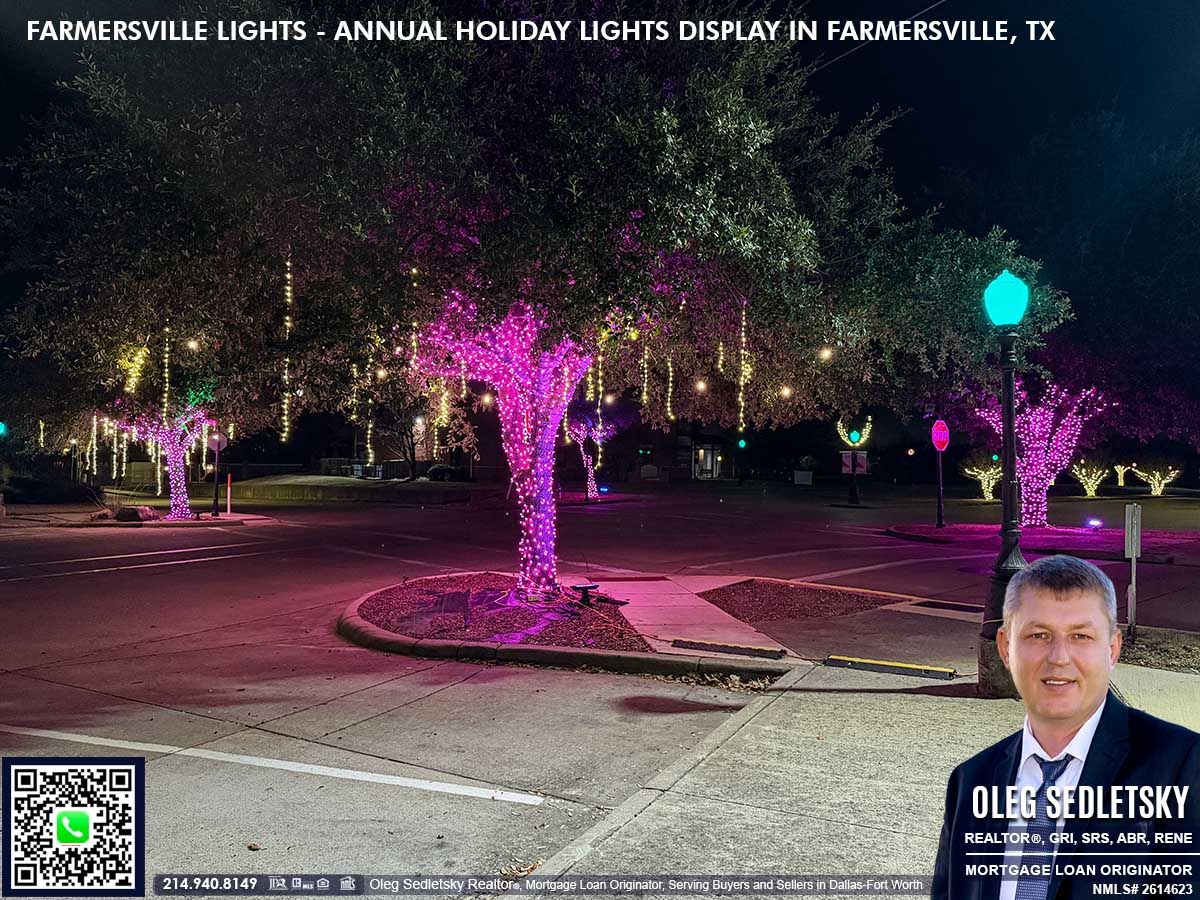
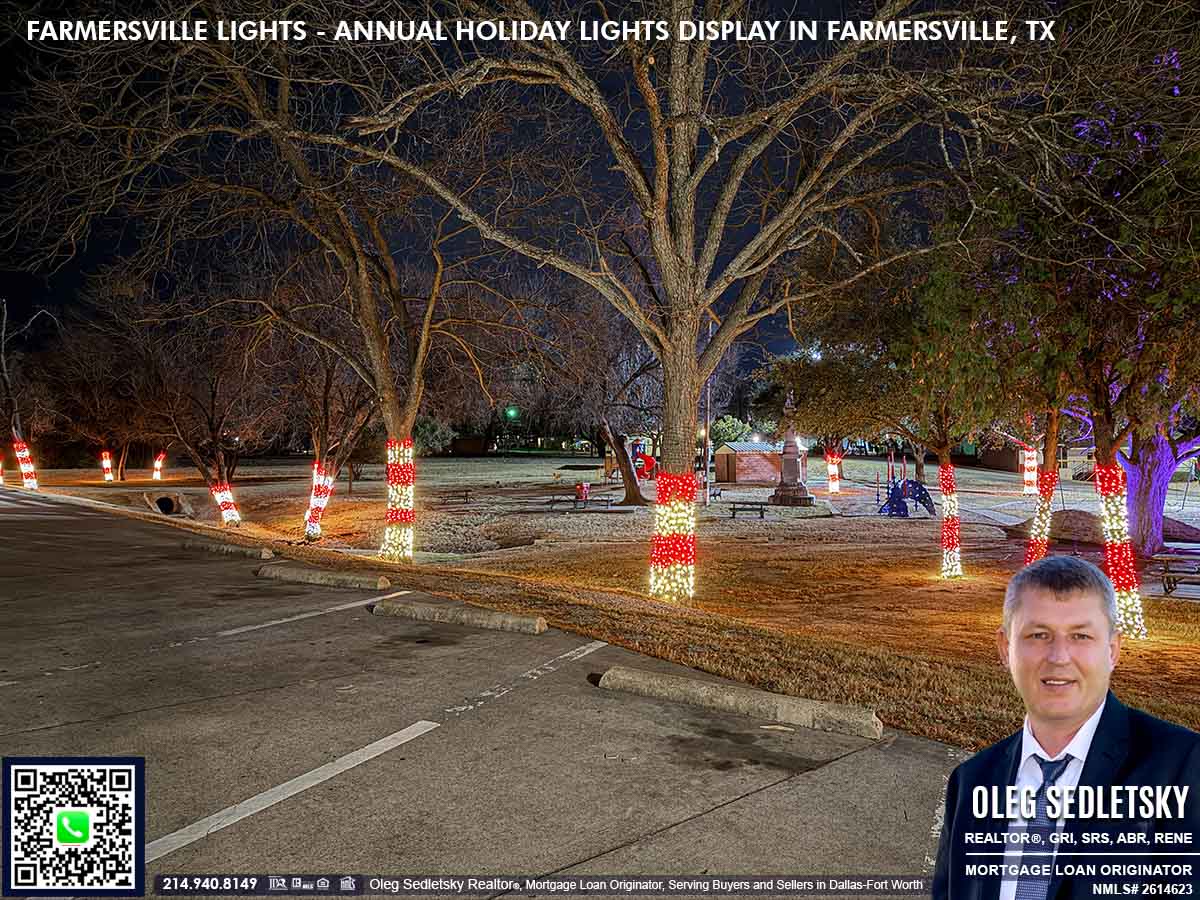
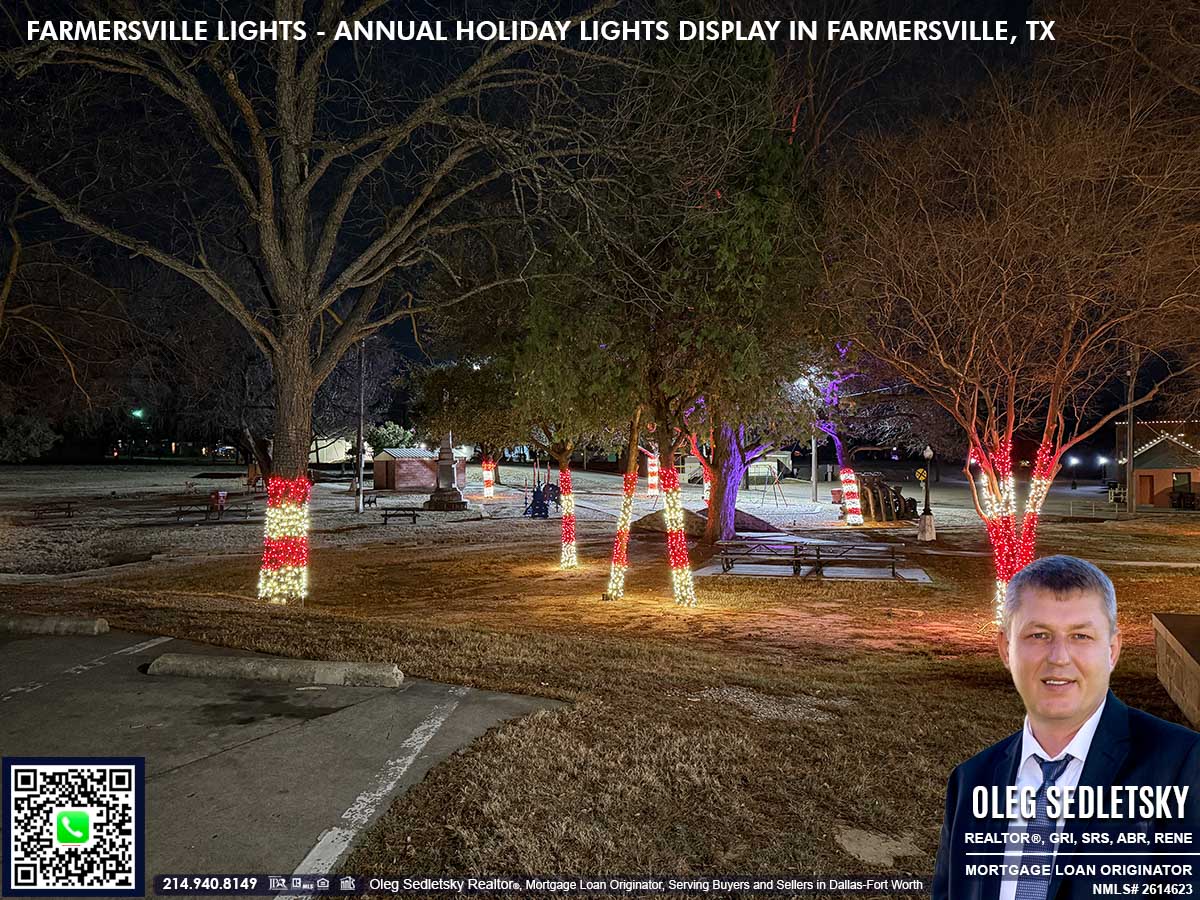
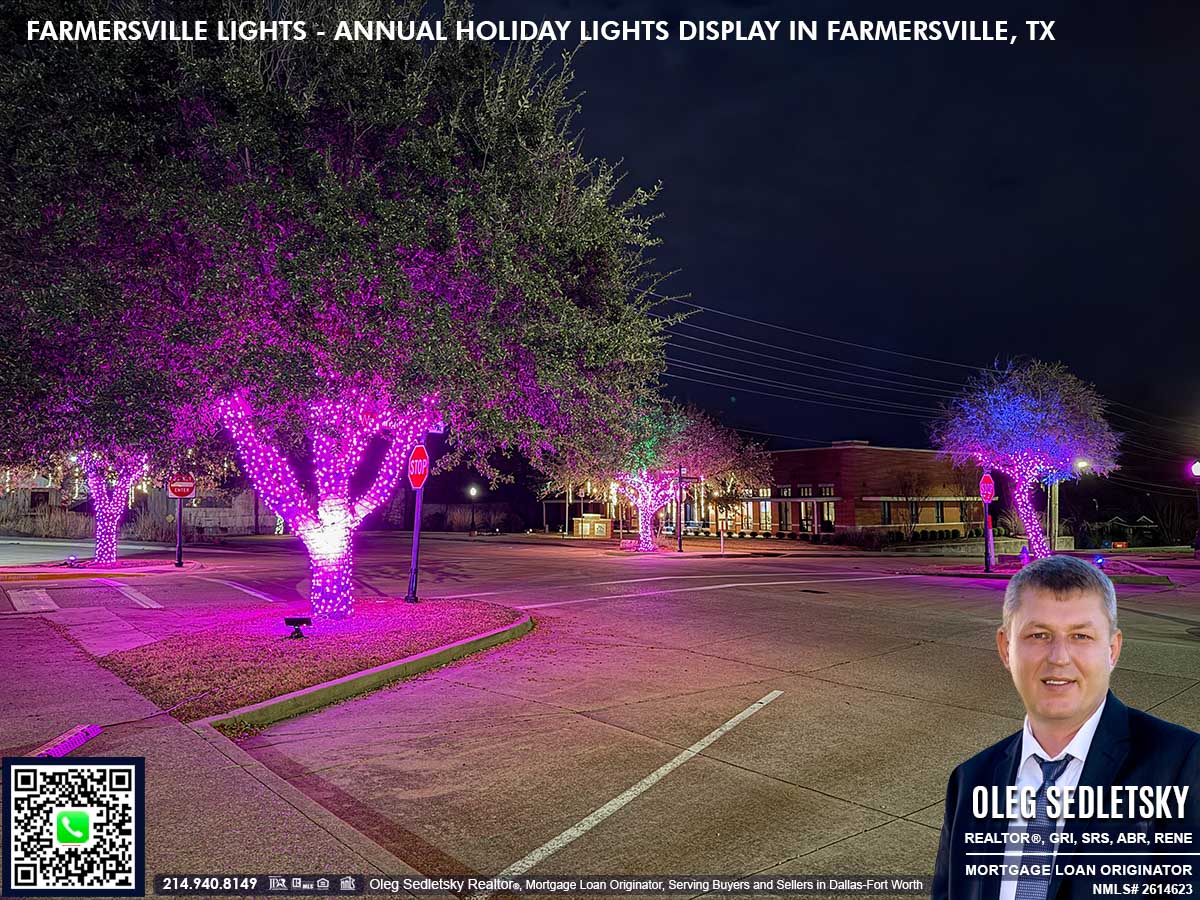
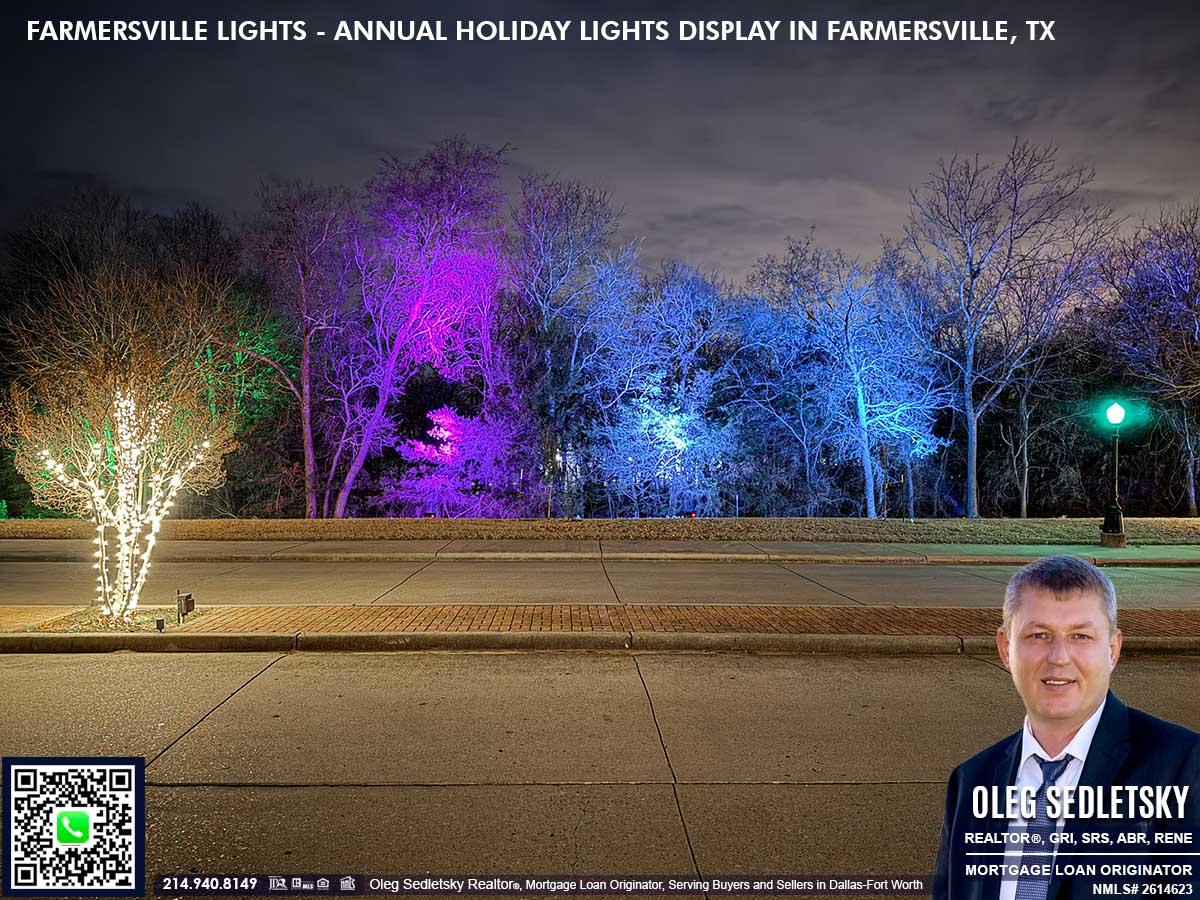
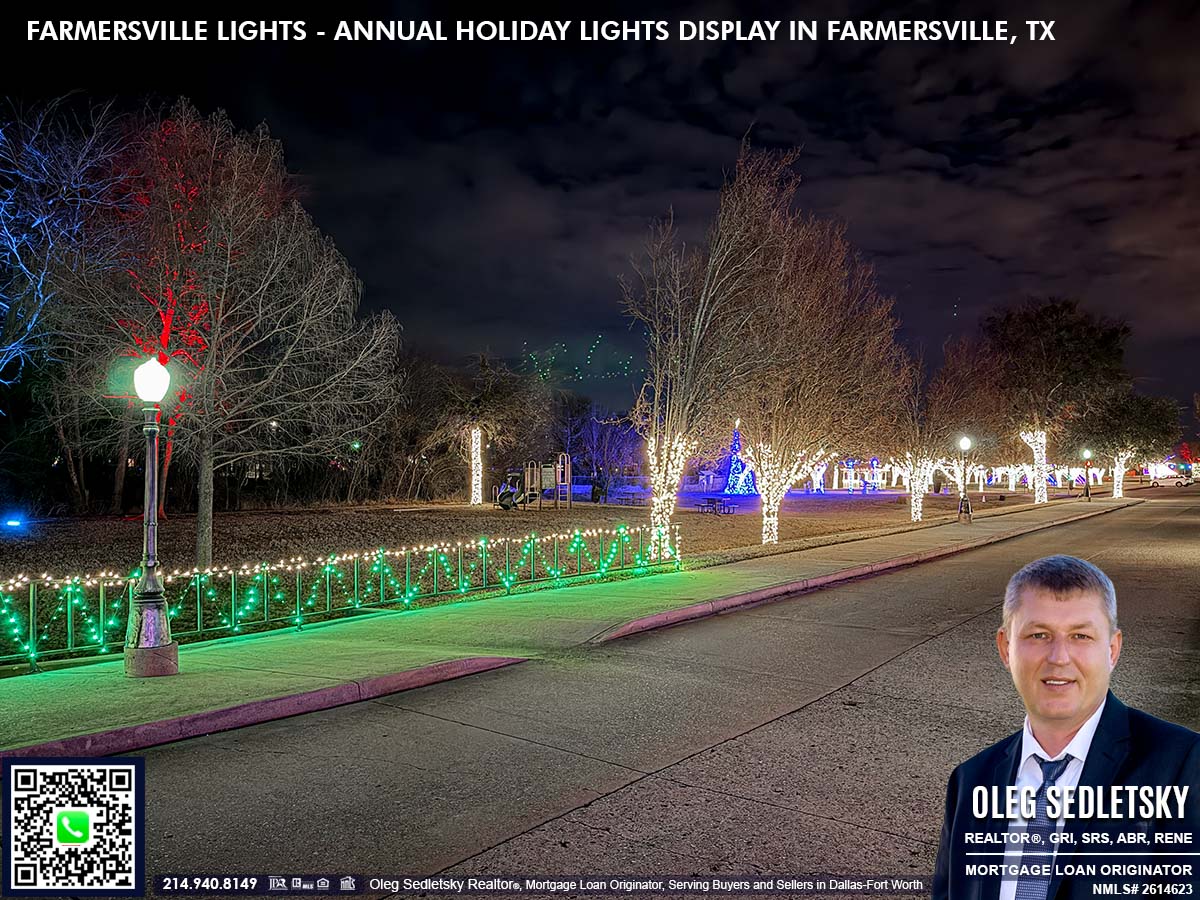
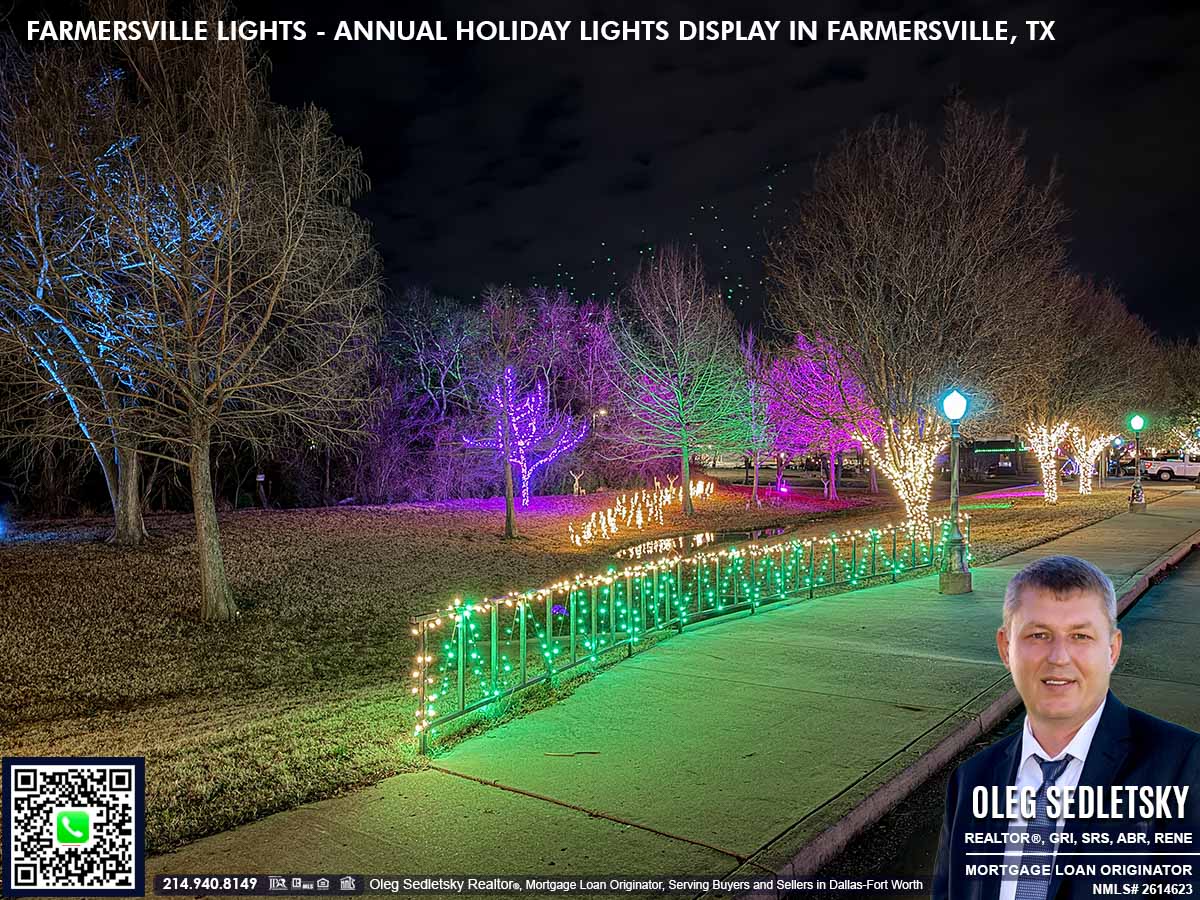
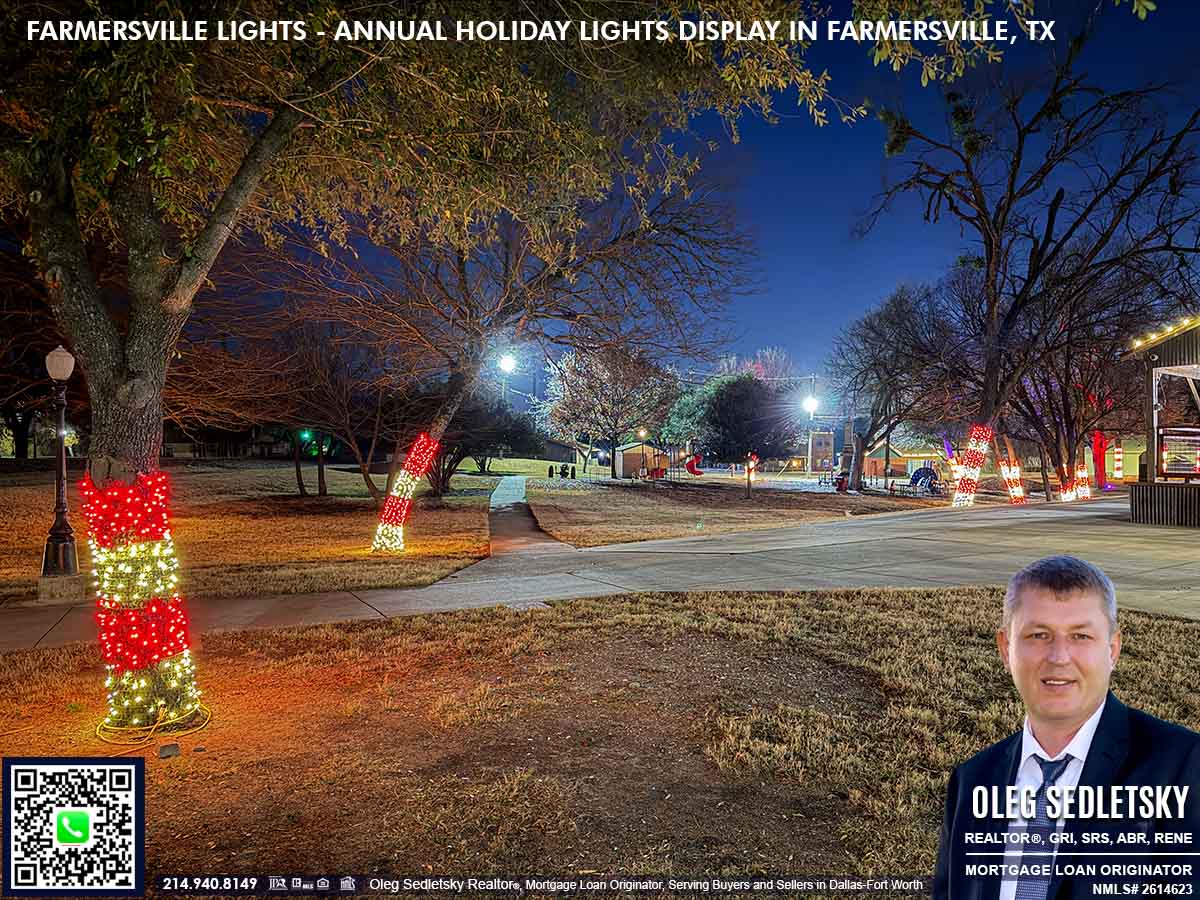
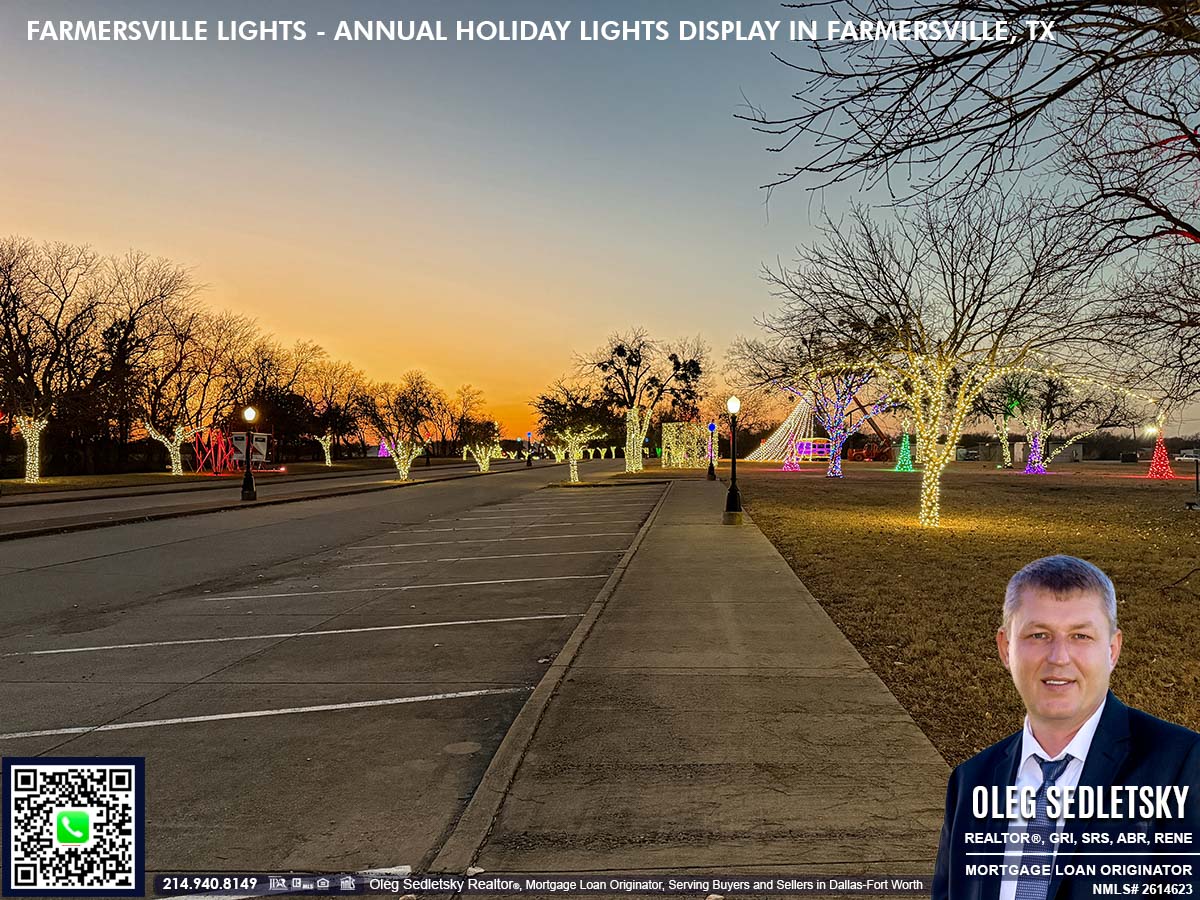
Surreal Colors in Rambler’s Park
Rambler’s Park offers a different kind of magic. The tree trunks are wrapped neatly with golden lights, but the real spectacle is above. Uplights project a constant cycle of colors onto the tree branches, shifting from green to red to violet. It creates a surreal experience, drawing your eyes upward to the changing canopy. For more information on this beautiful park, feel free to check out my write-up on Rambler’s Park.

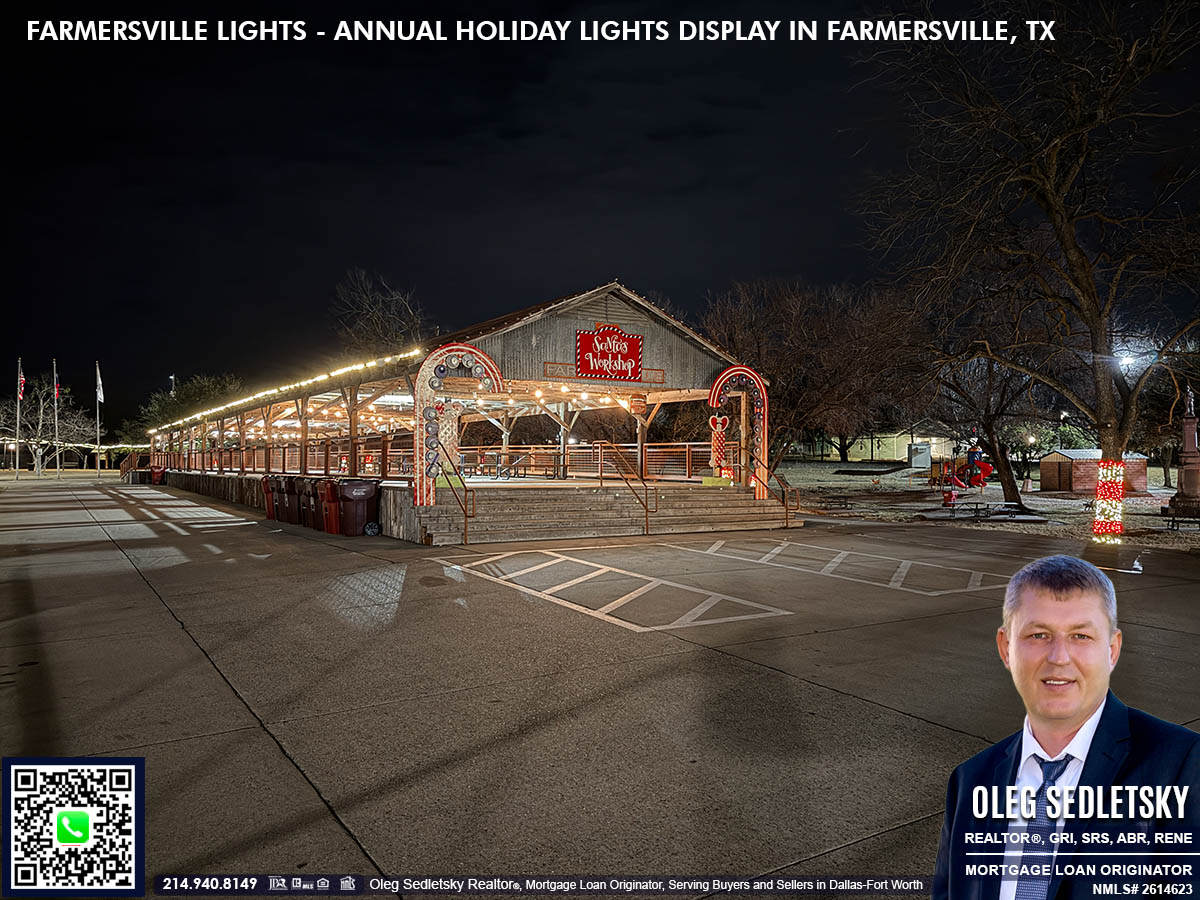
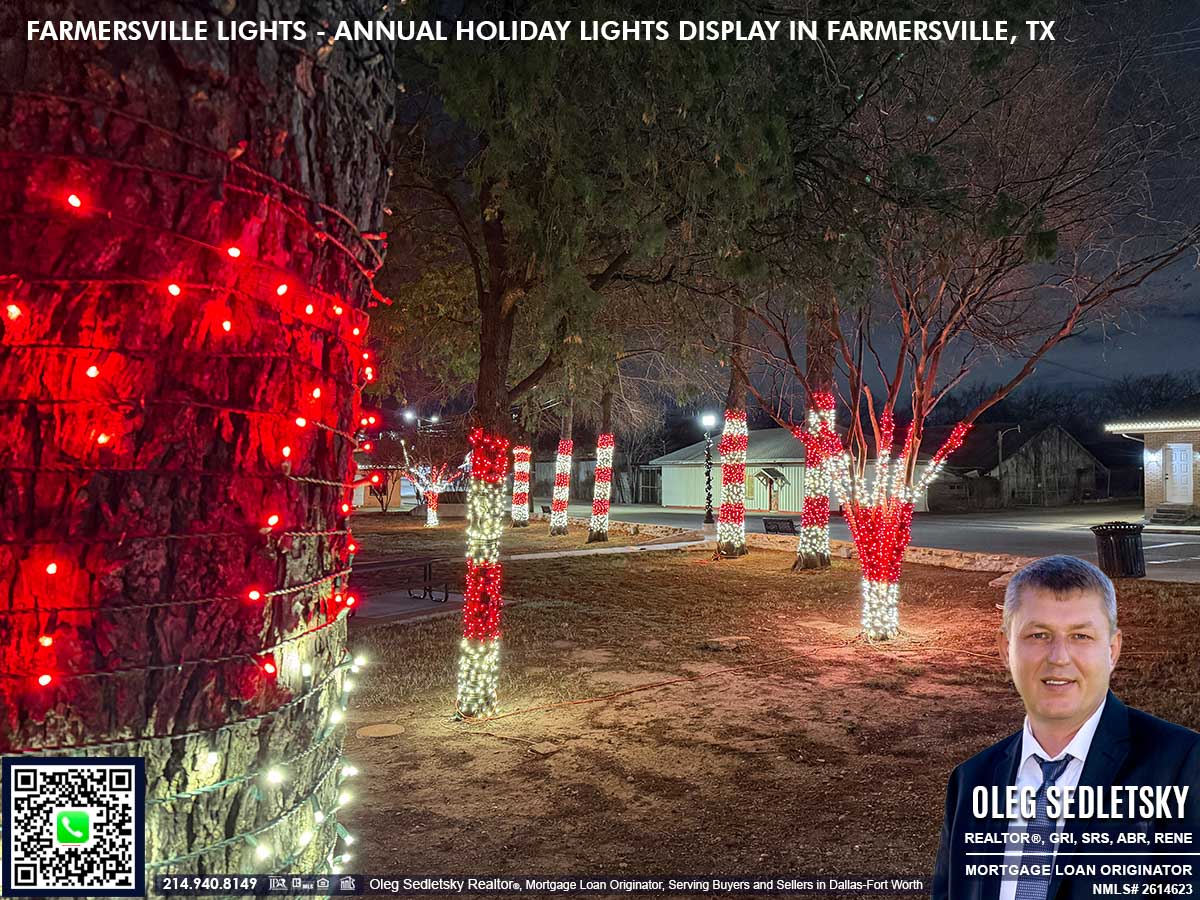
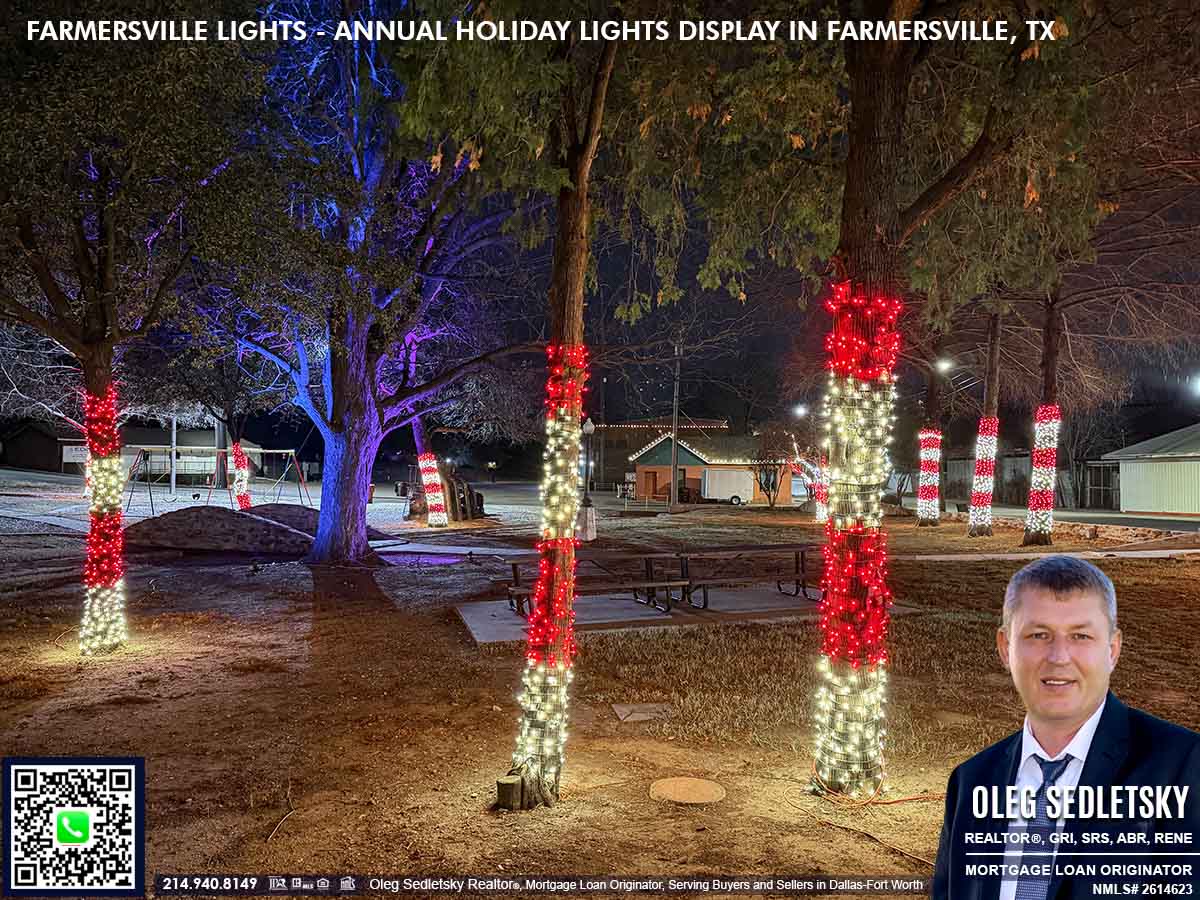
Sweet Sights on Candy Cane Lane
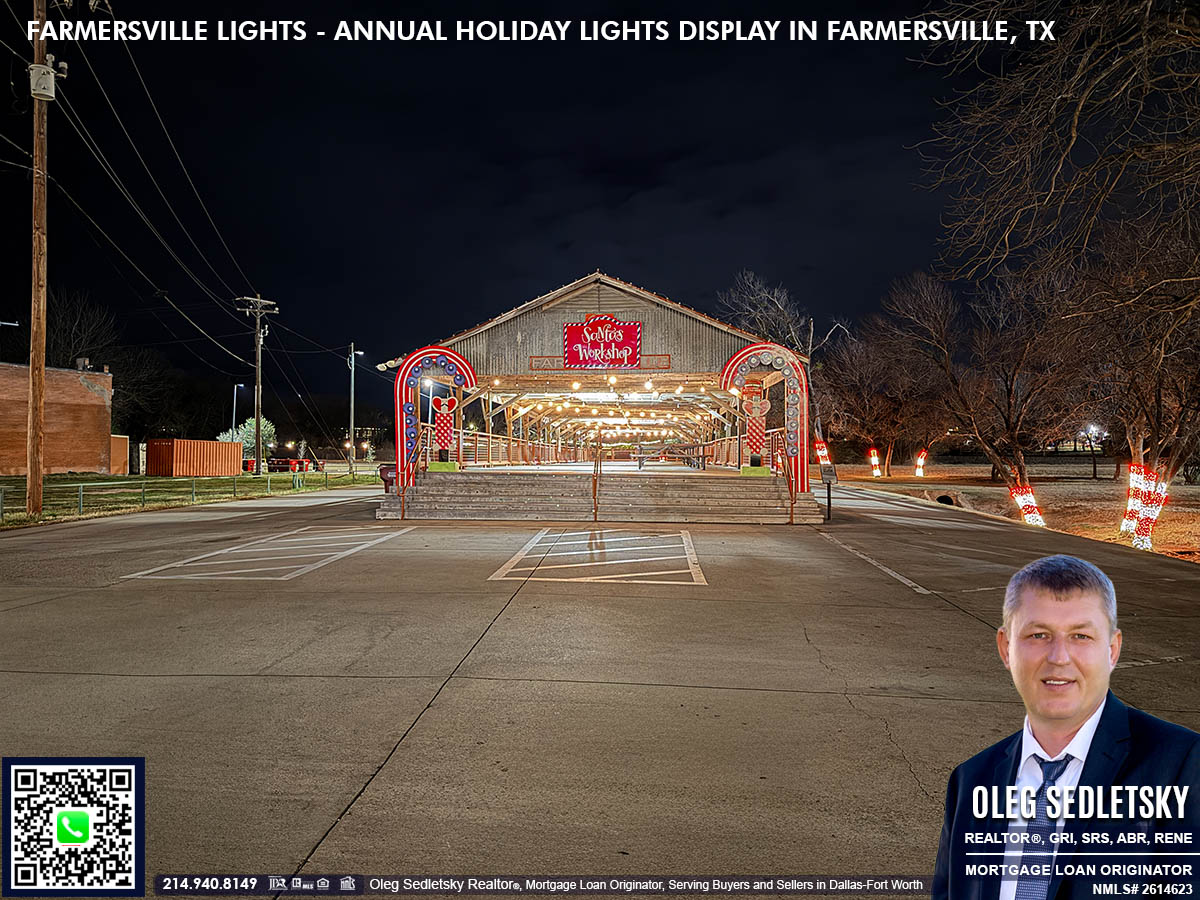
Just near the historic Onion Shed, you’ll find Candy Cane Lane. The trees here are wrapped in red and white lights, creating a delightful candy cane forest that looks good enough to eat. The Onion Shed itself becomes “Santa’s Workshop,” featuring a life-sized wooden sleigh perfect for grabbing that classic Christmas photo.
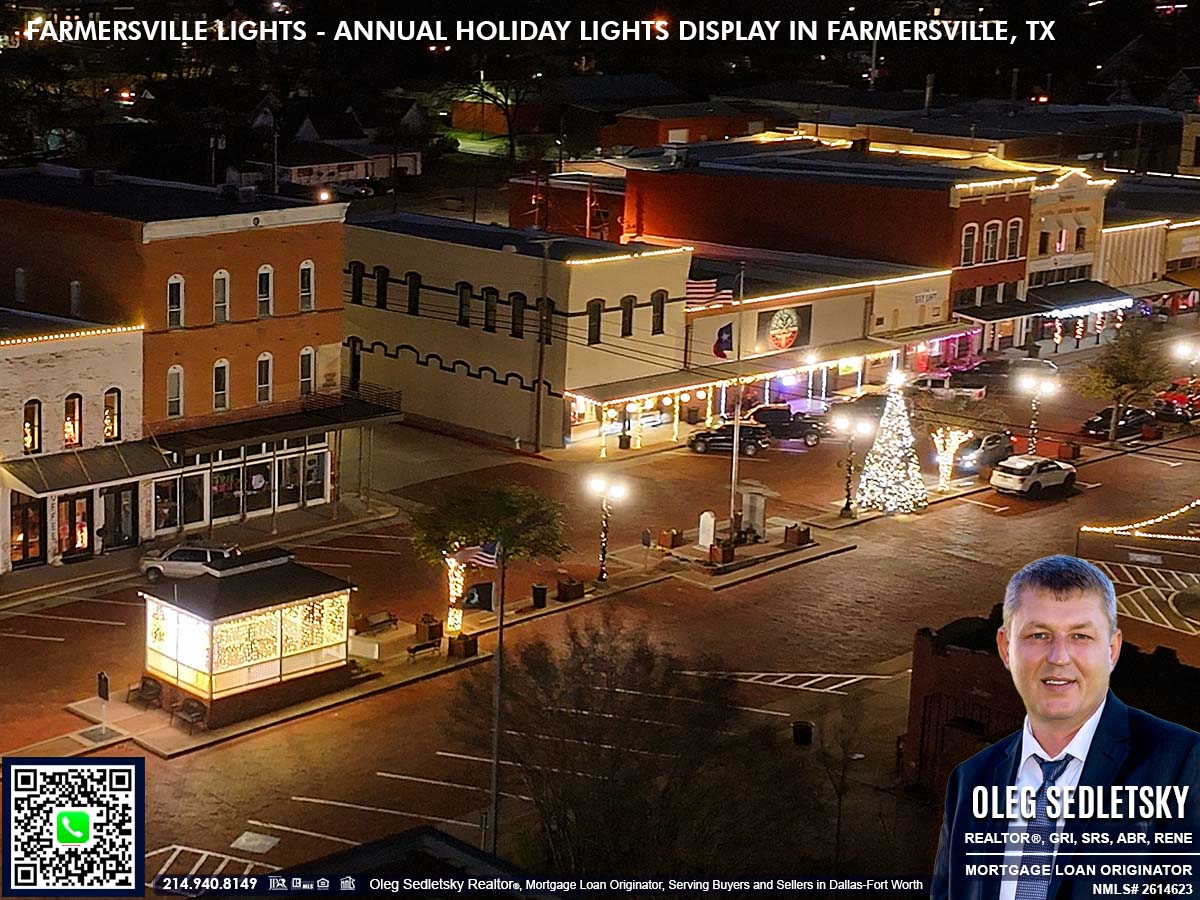
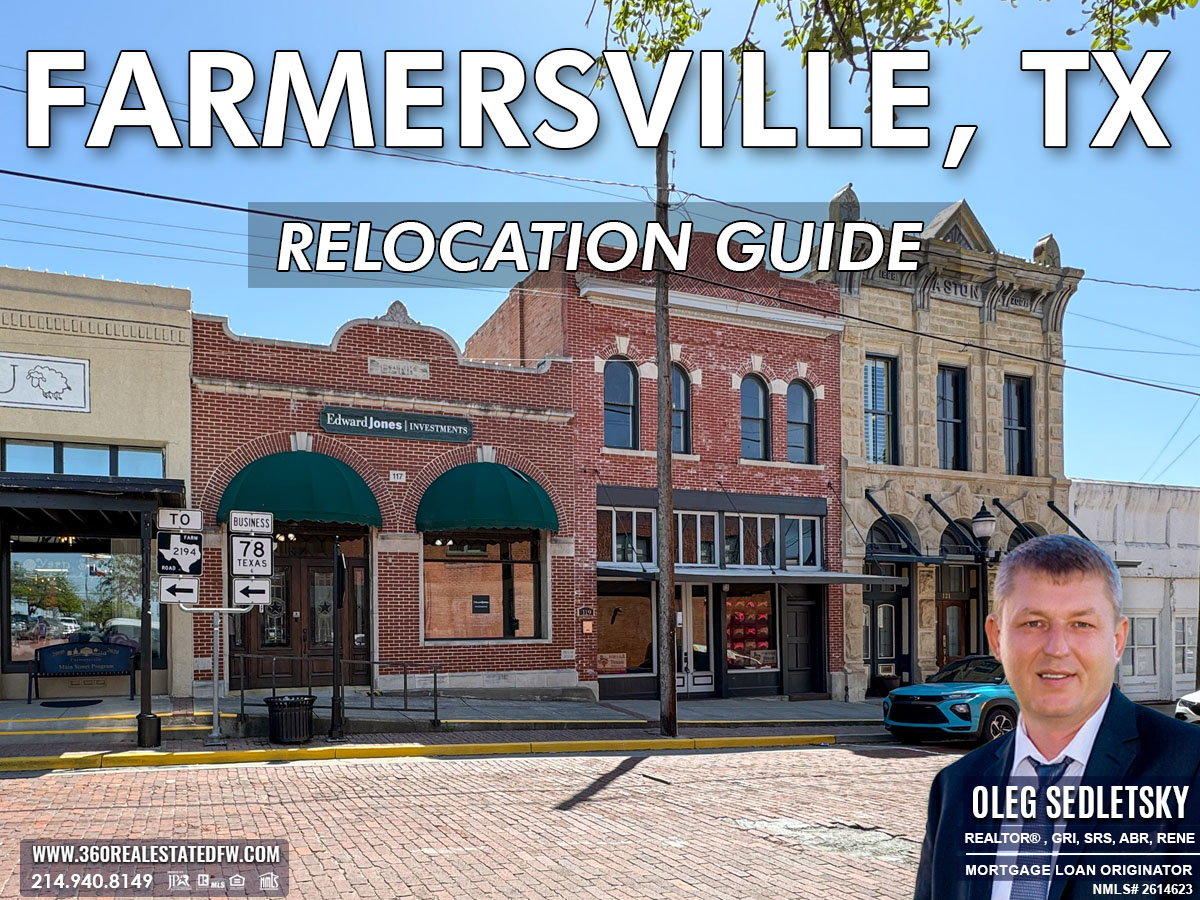
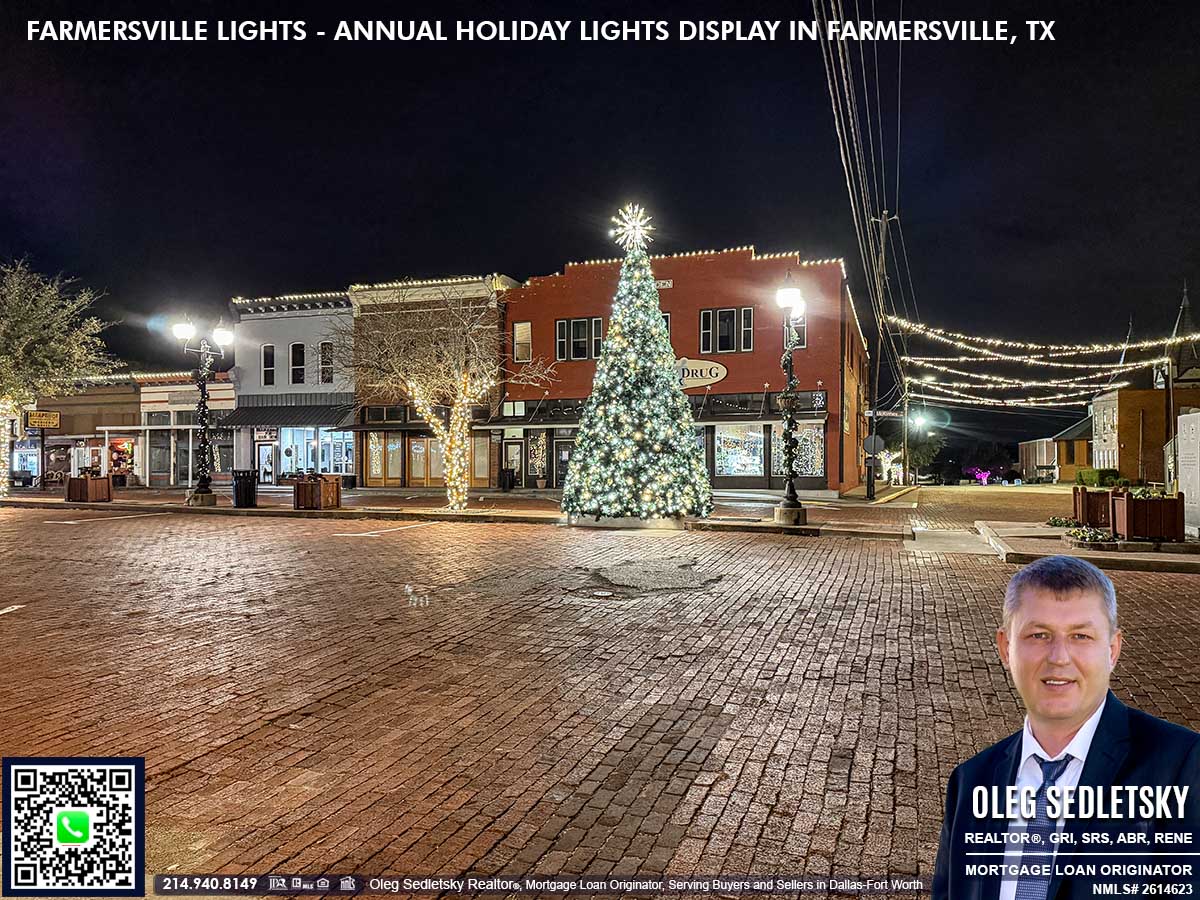
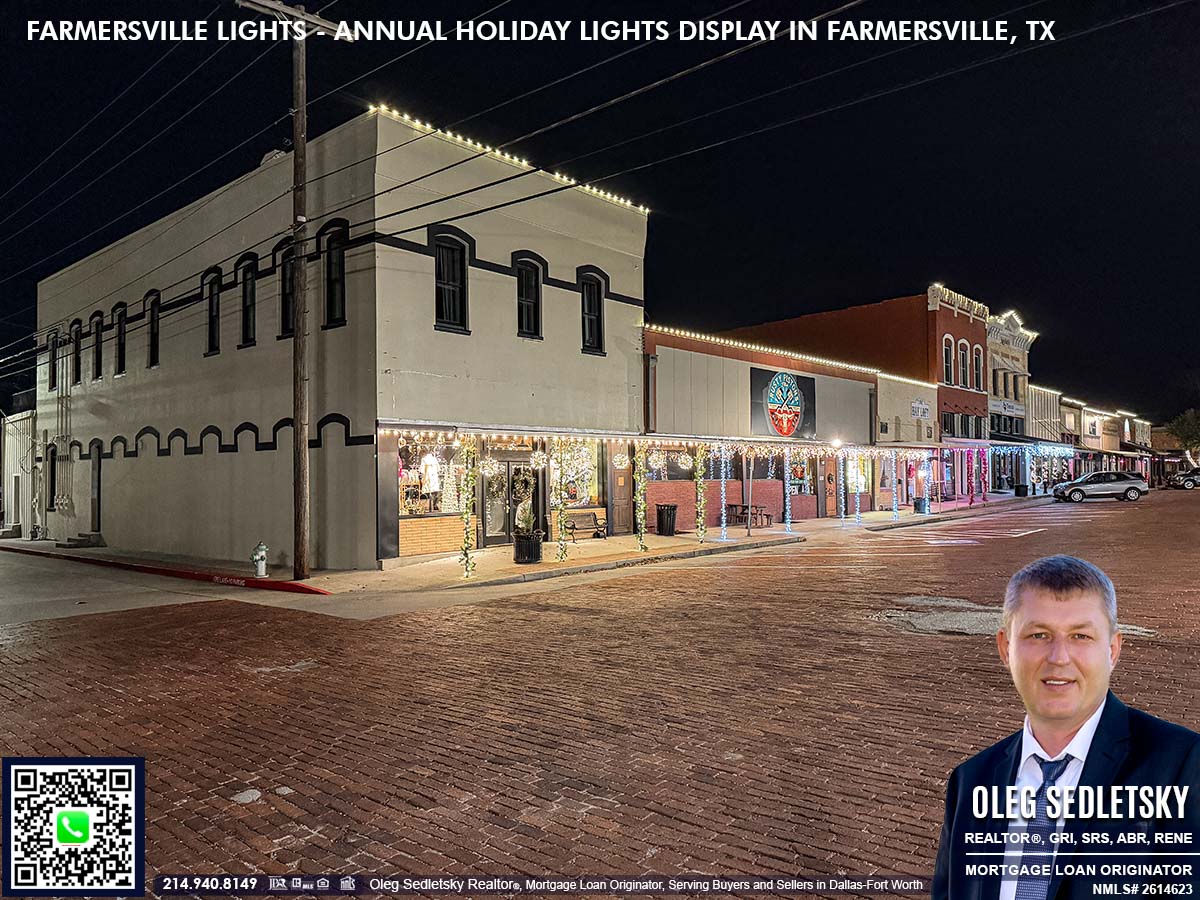
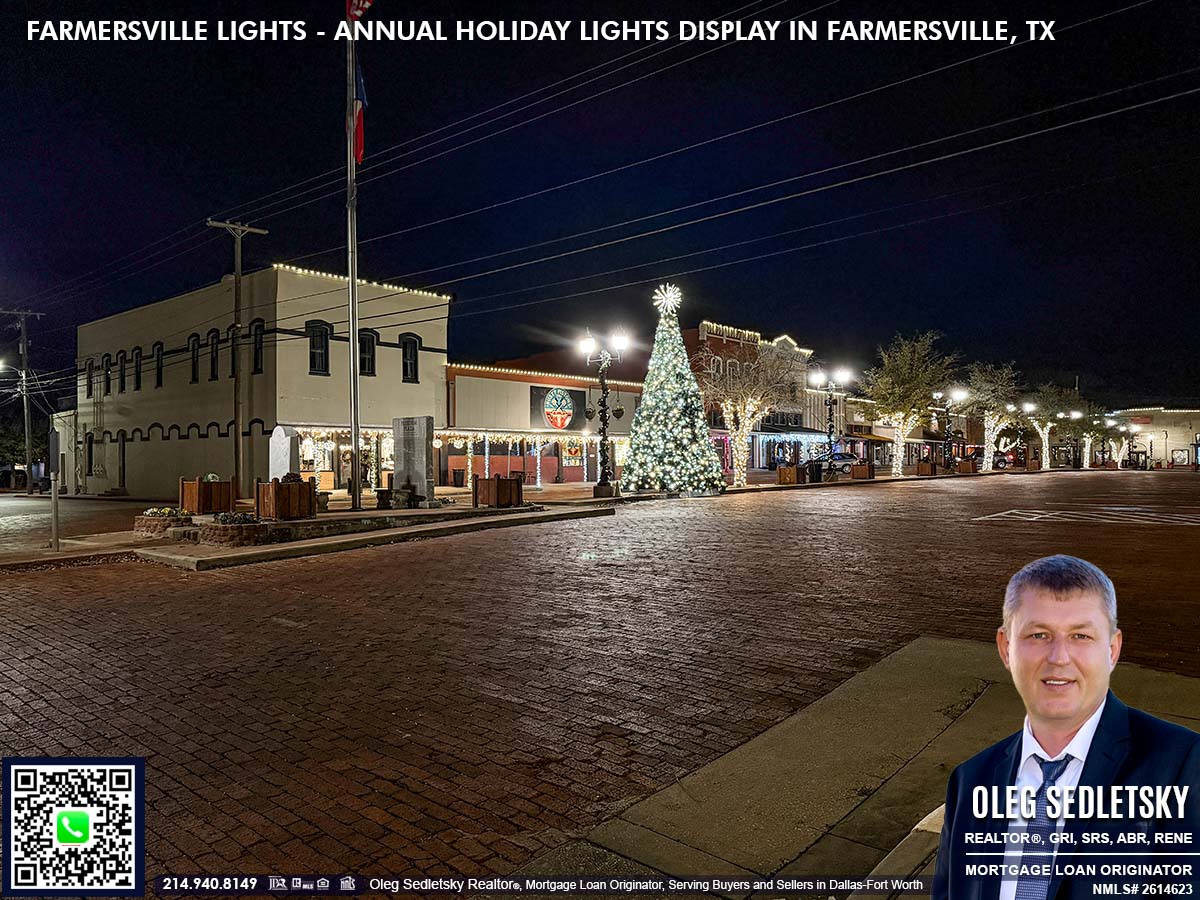
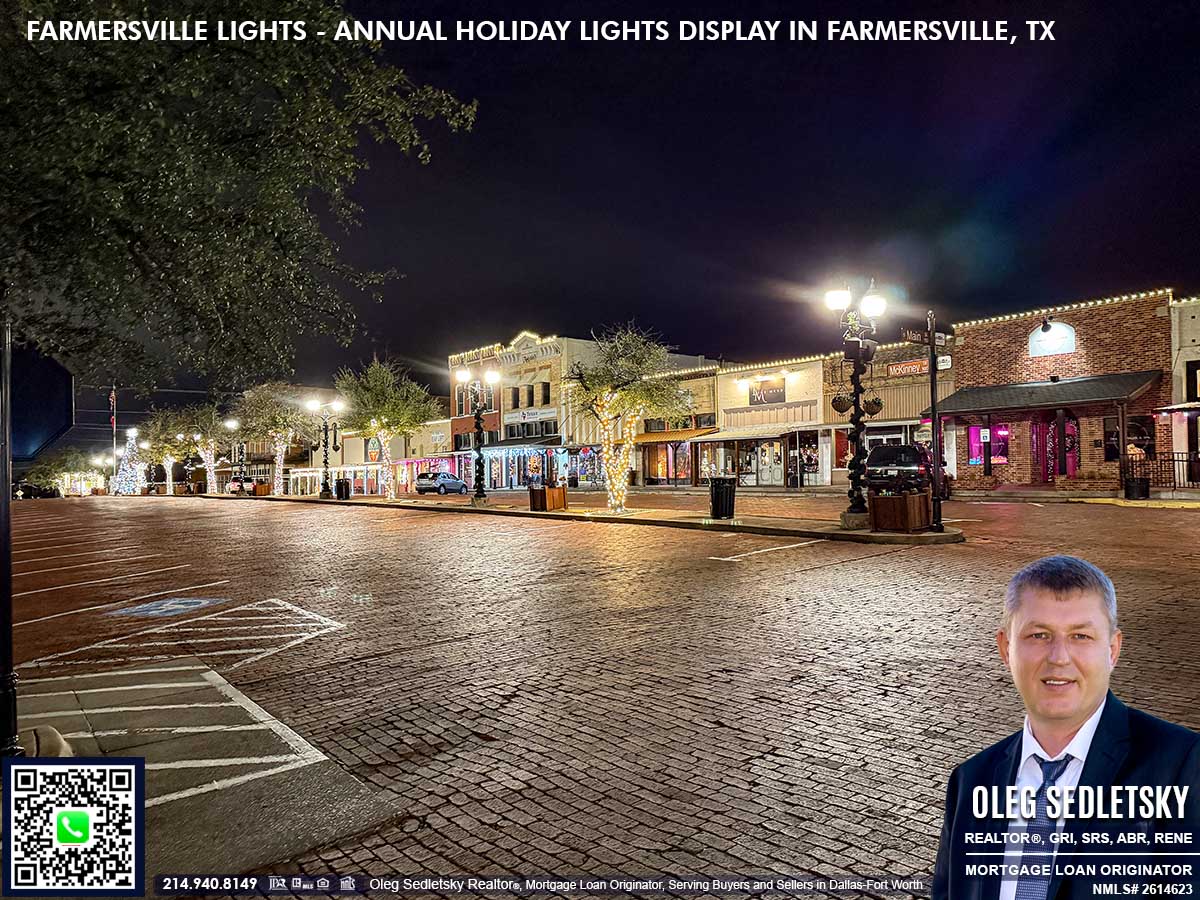
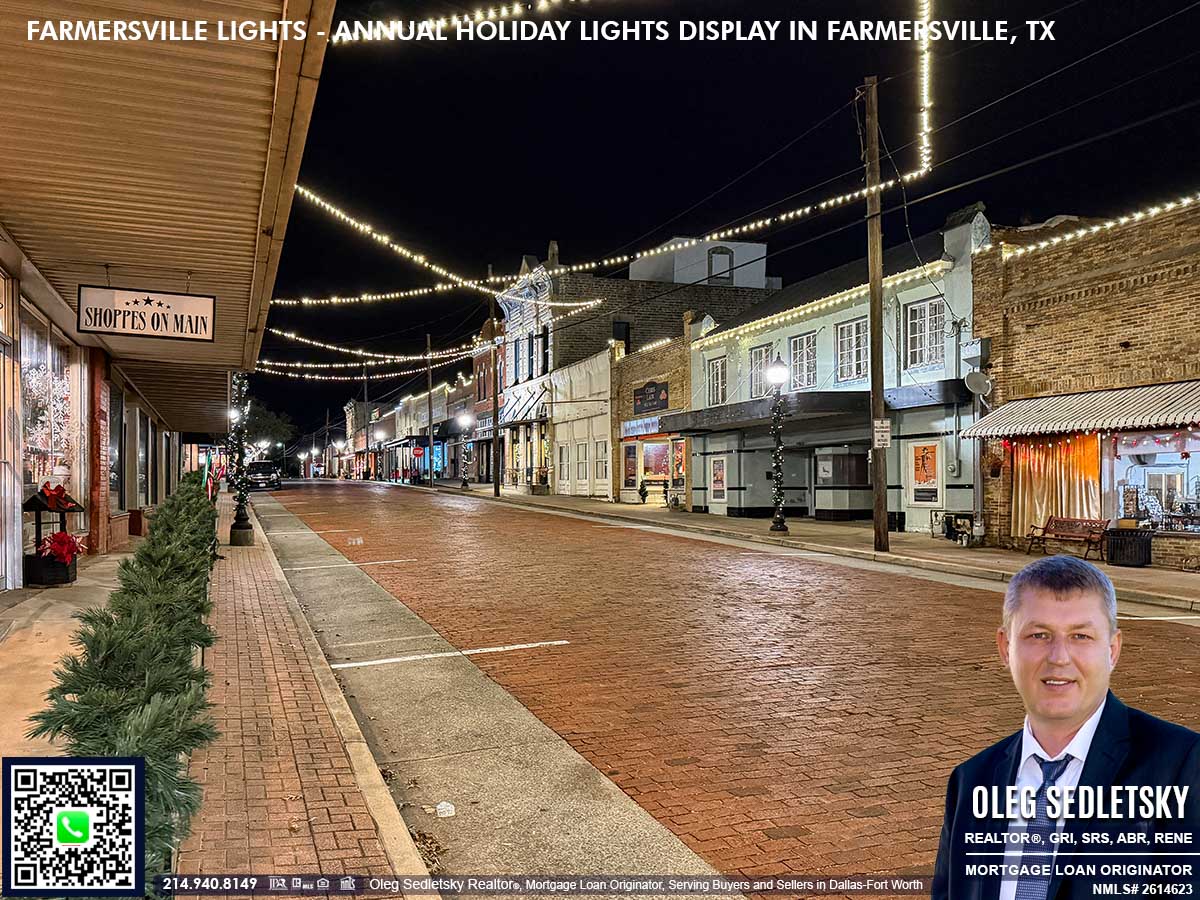
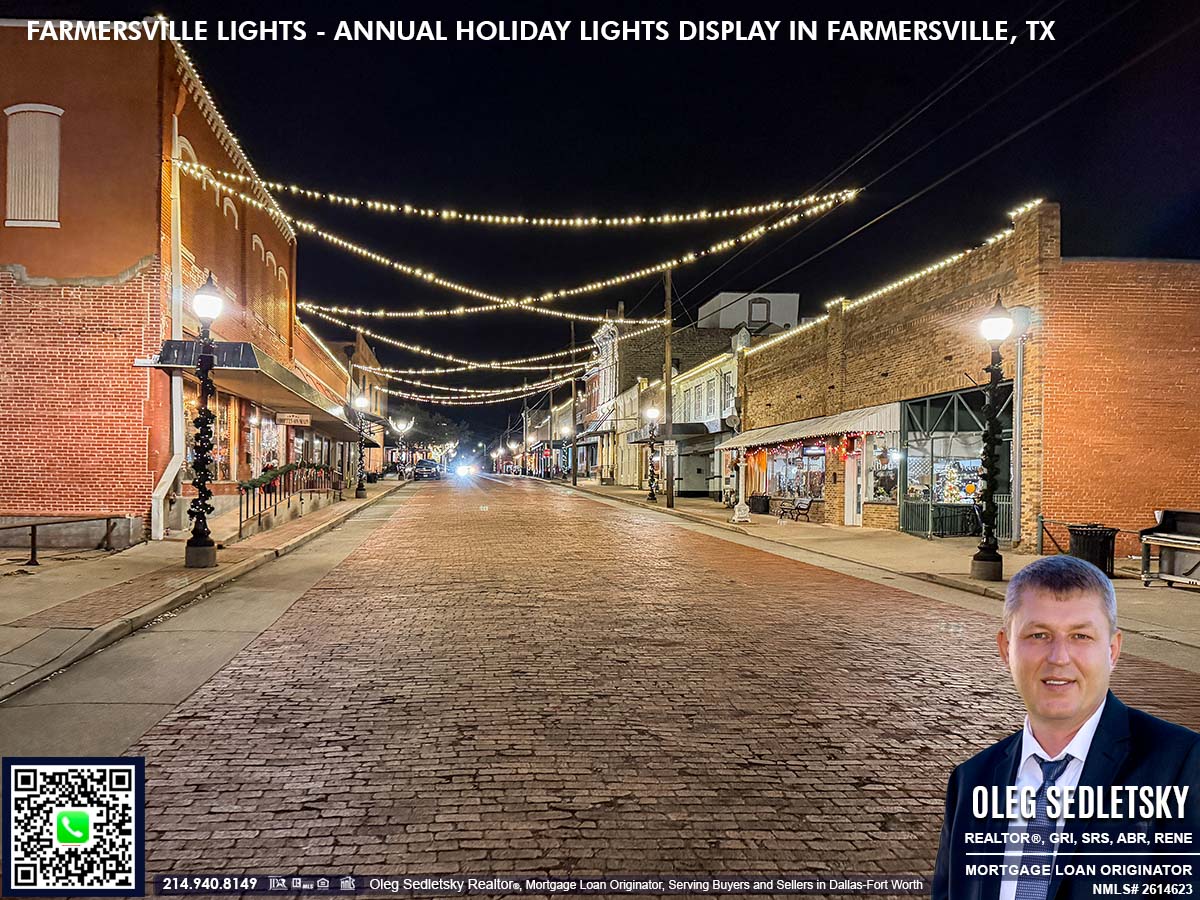
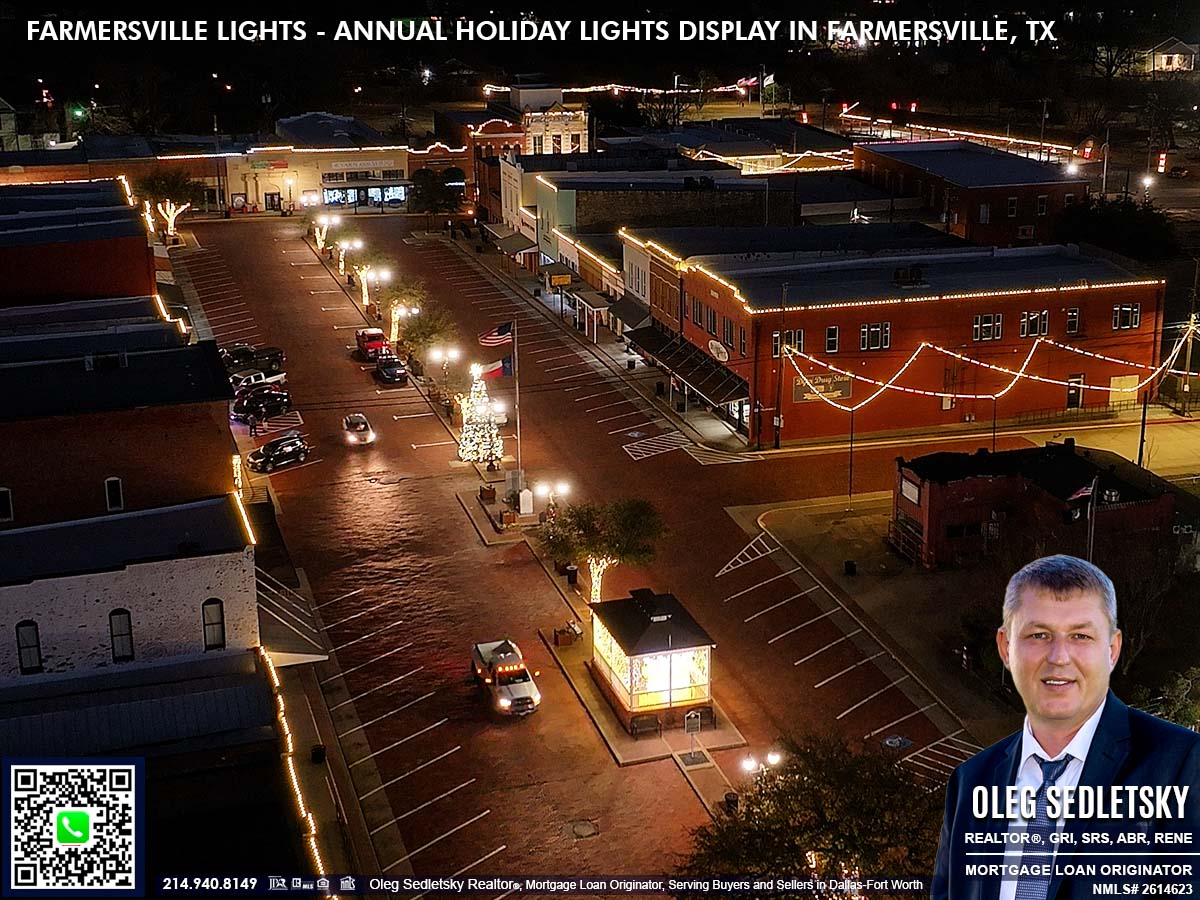
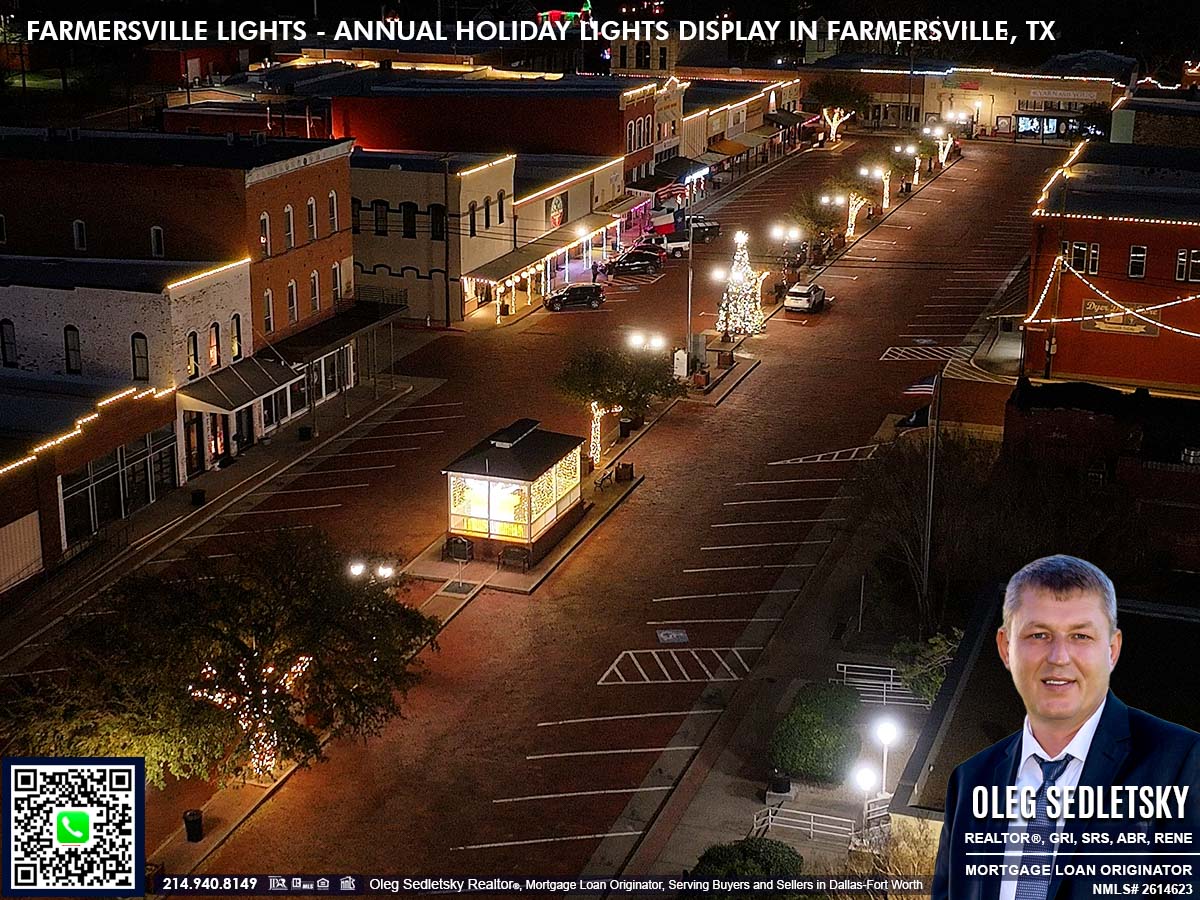
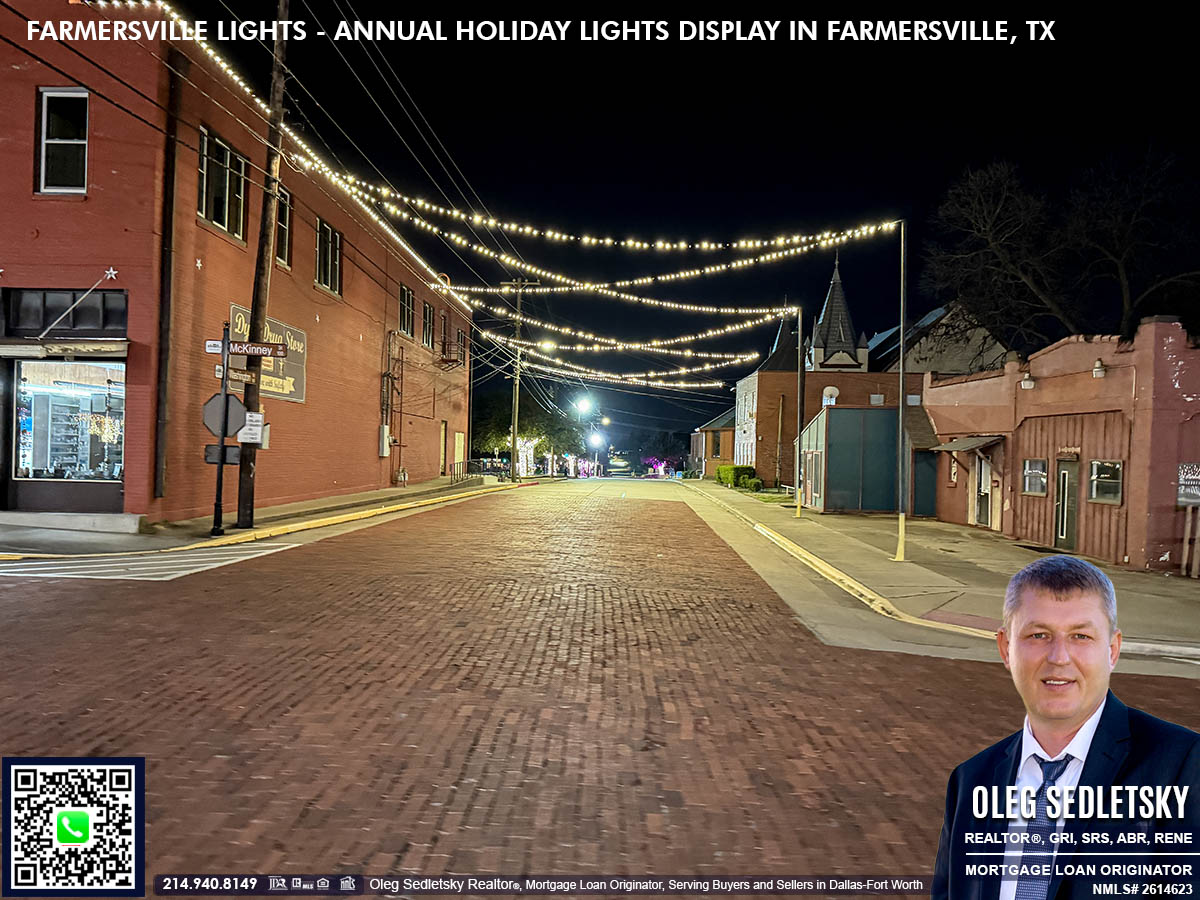
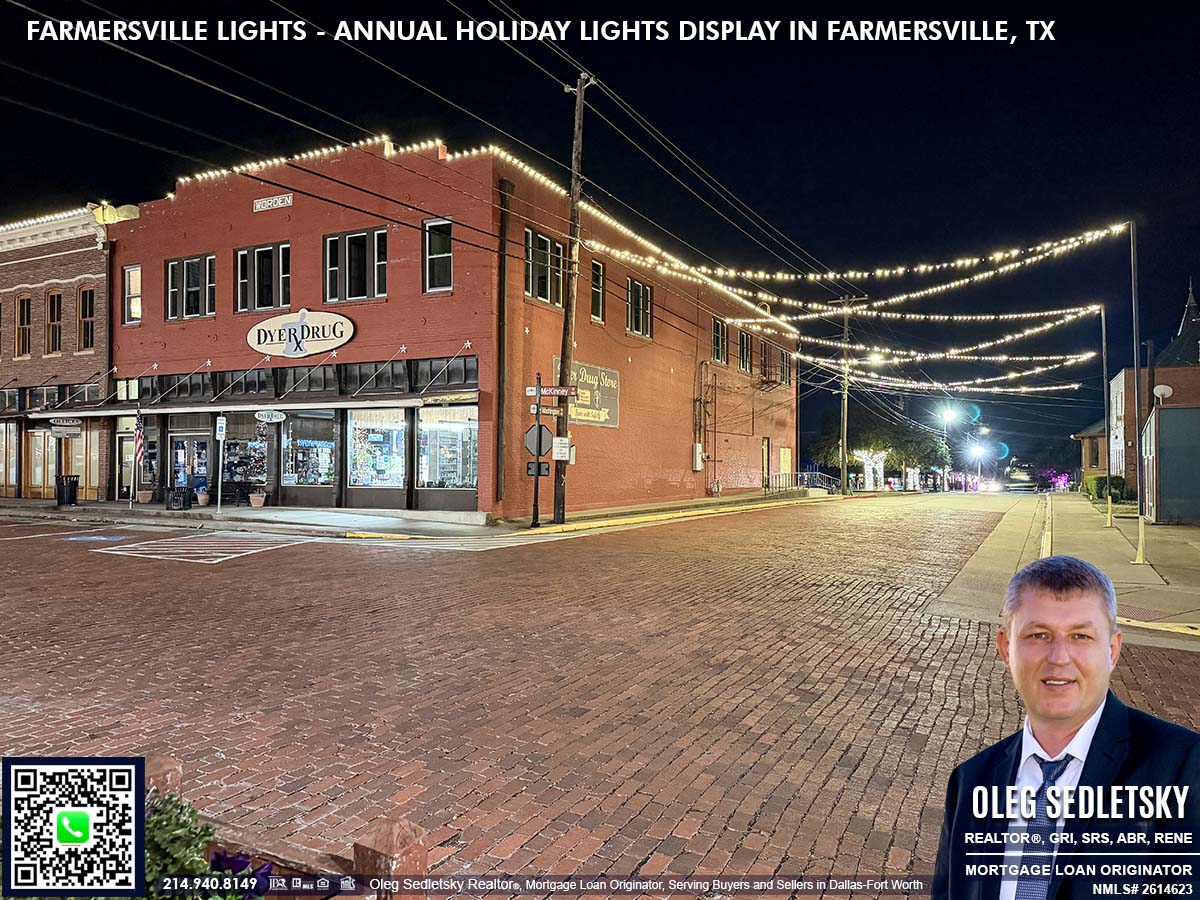
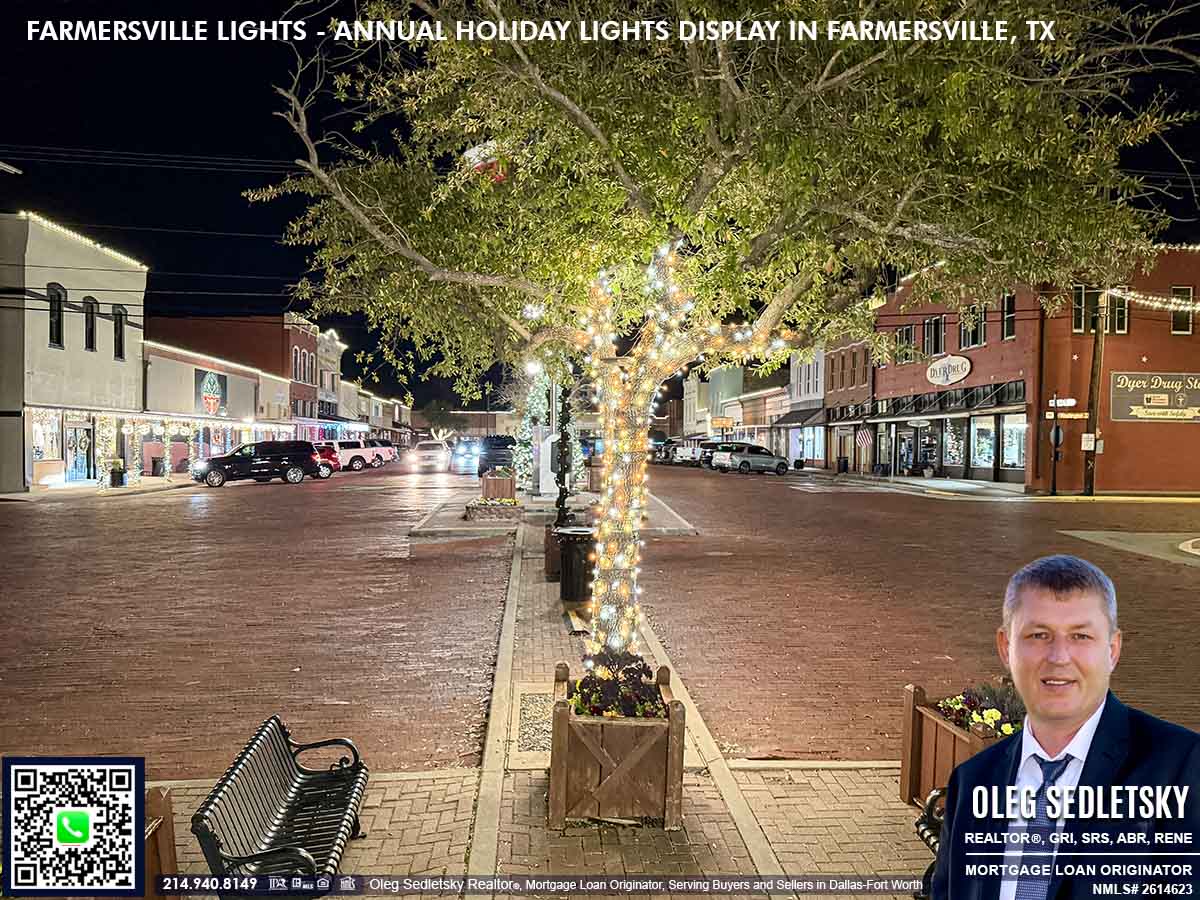
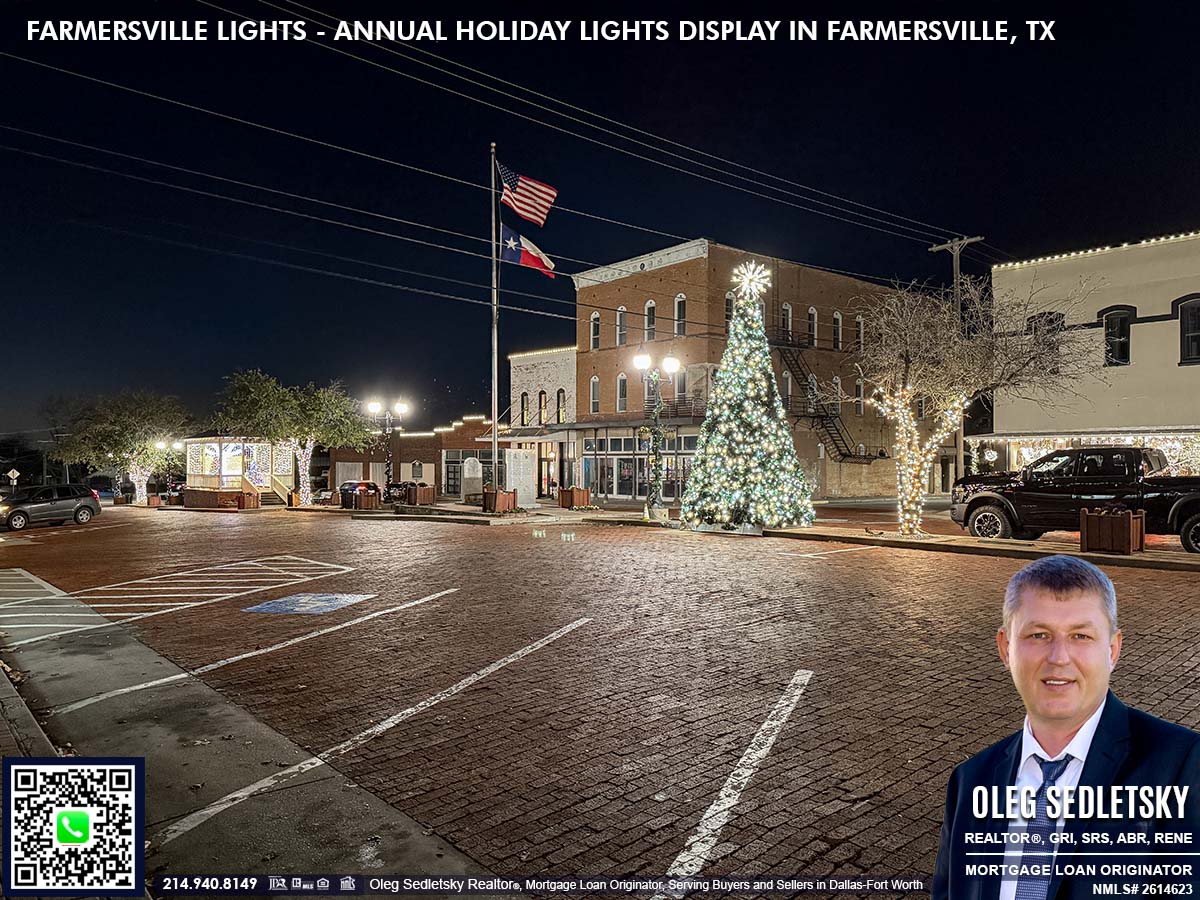
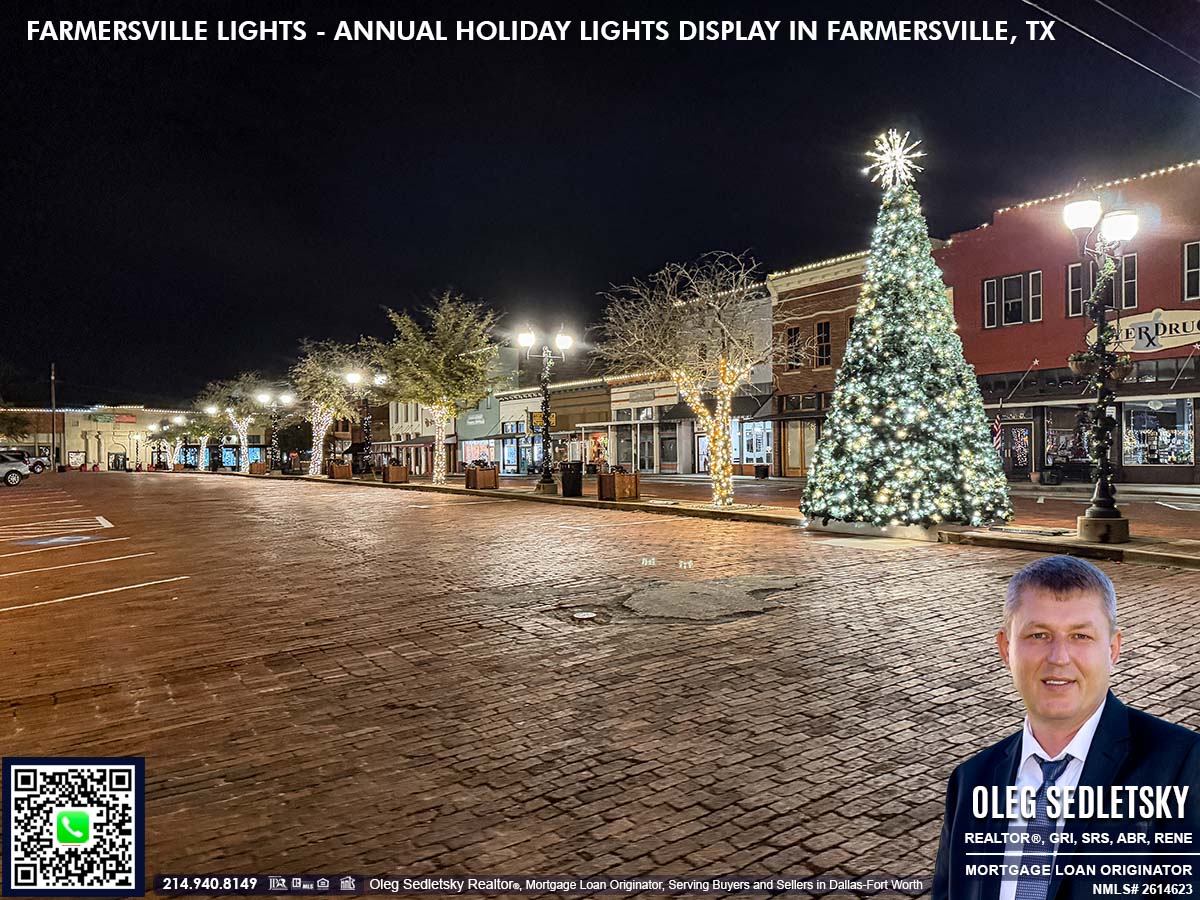
Historic Downtown Farmersville’s Charm
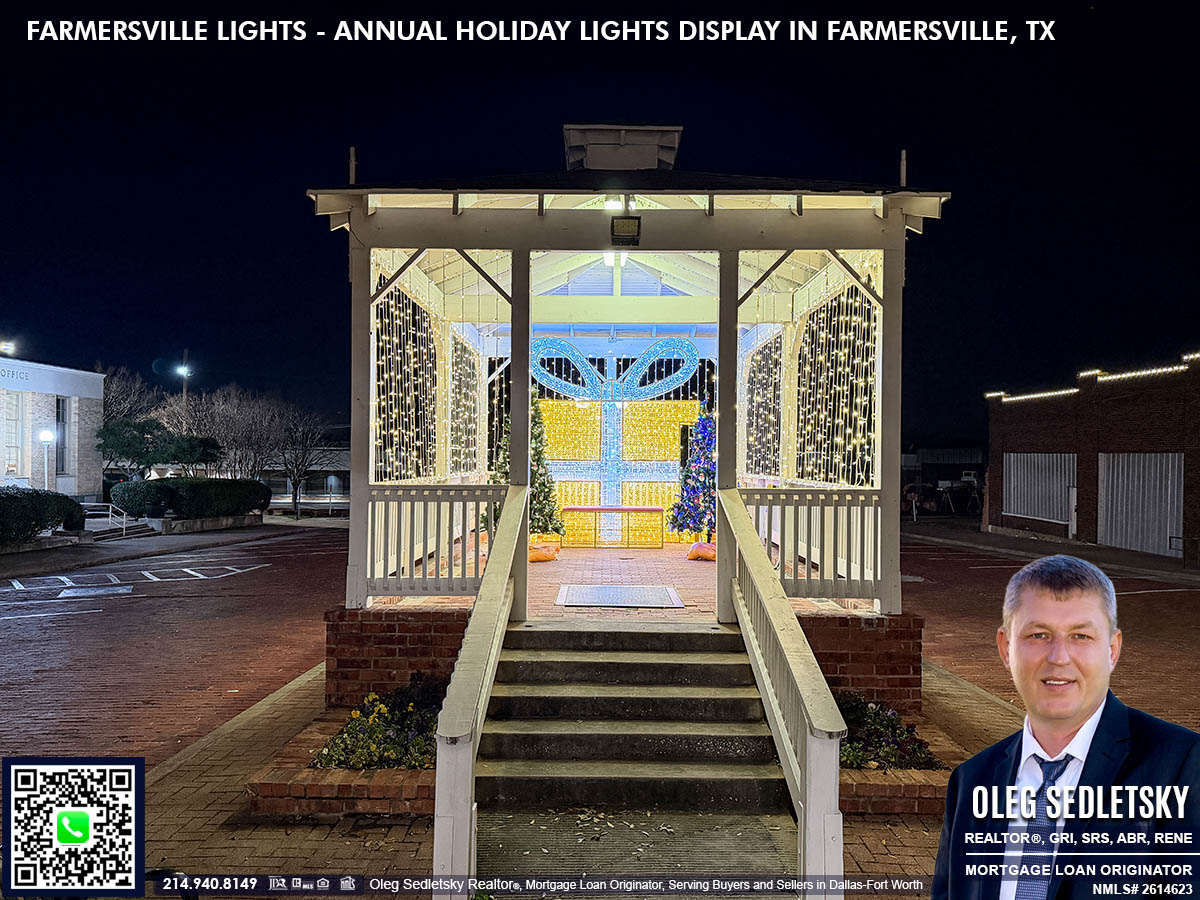
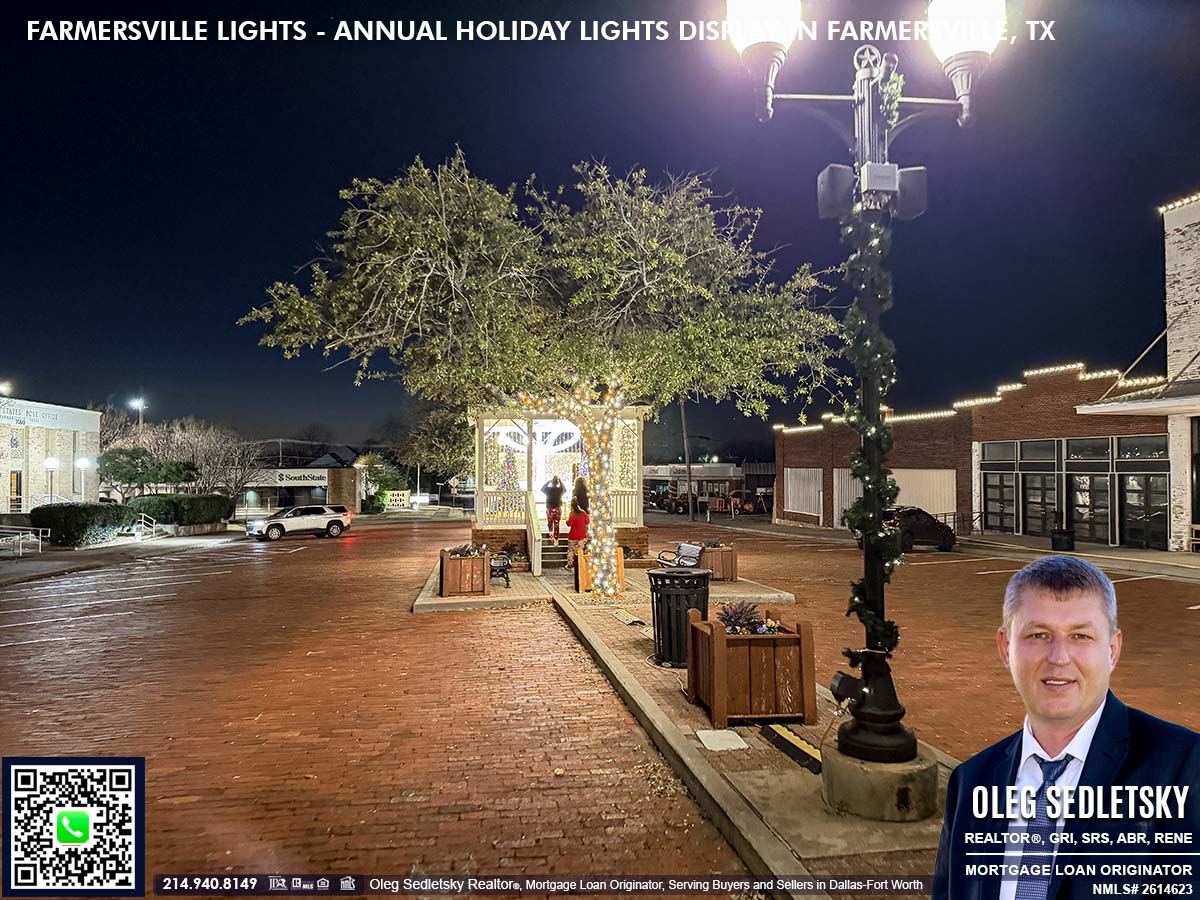
The journey culminates in historic Downtown Farmersville, the true heart of the celebration. A magnificent Christmas tree stands tall, the Freedom Plaza pavilion is laced with lights, and nearly every historic building is dressed in its holiday best. The entire downtown glows with a warm, inviting light that makes you want to linger and enjoy the moment.
It is the perfect picture of small-town holiday cheer.

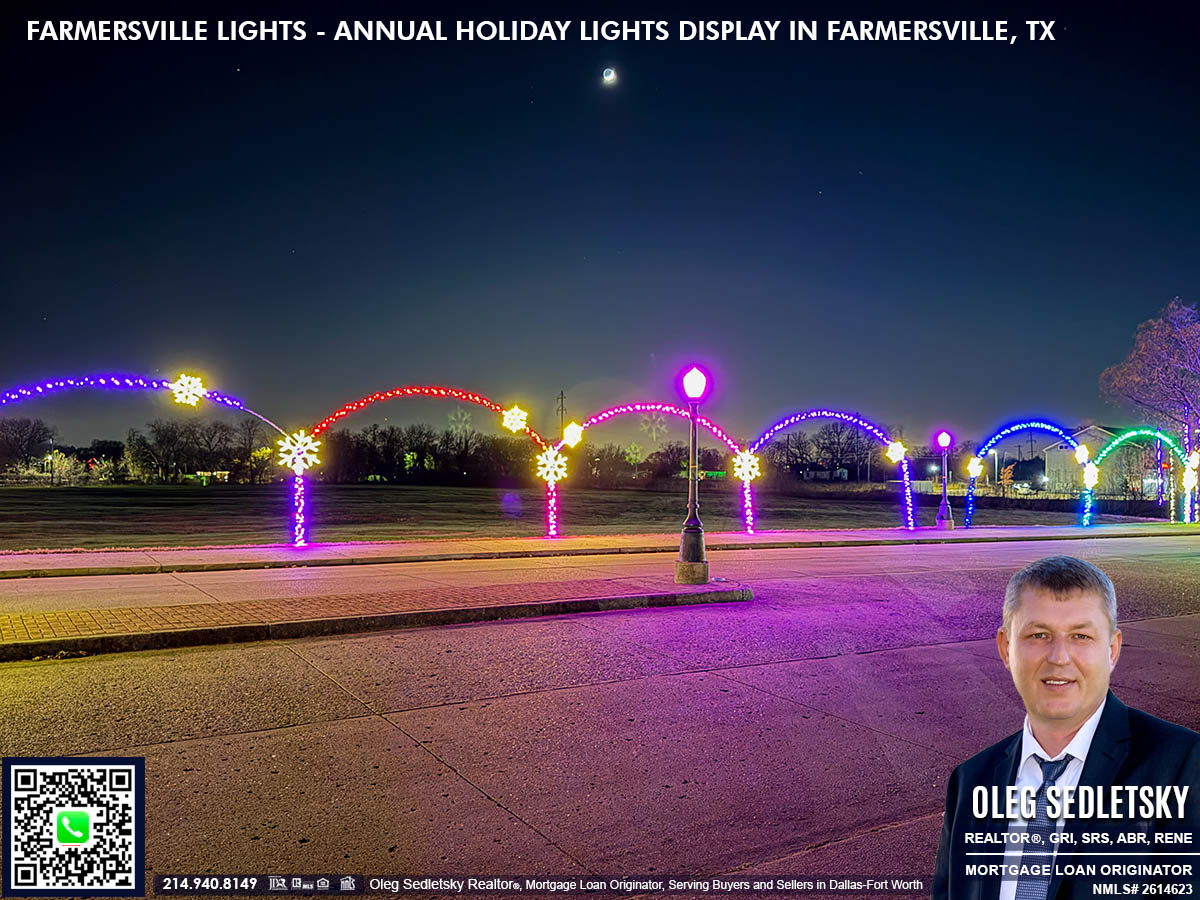
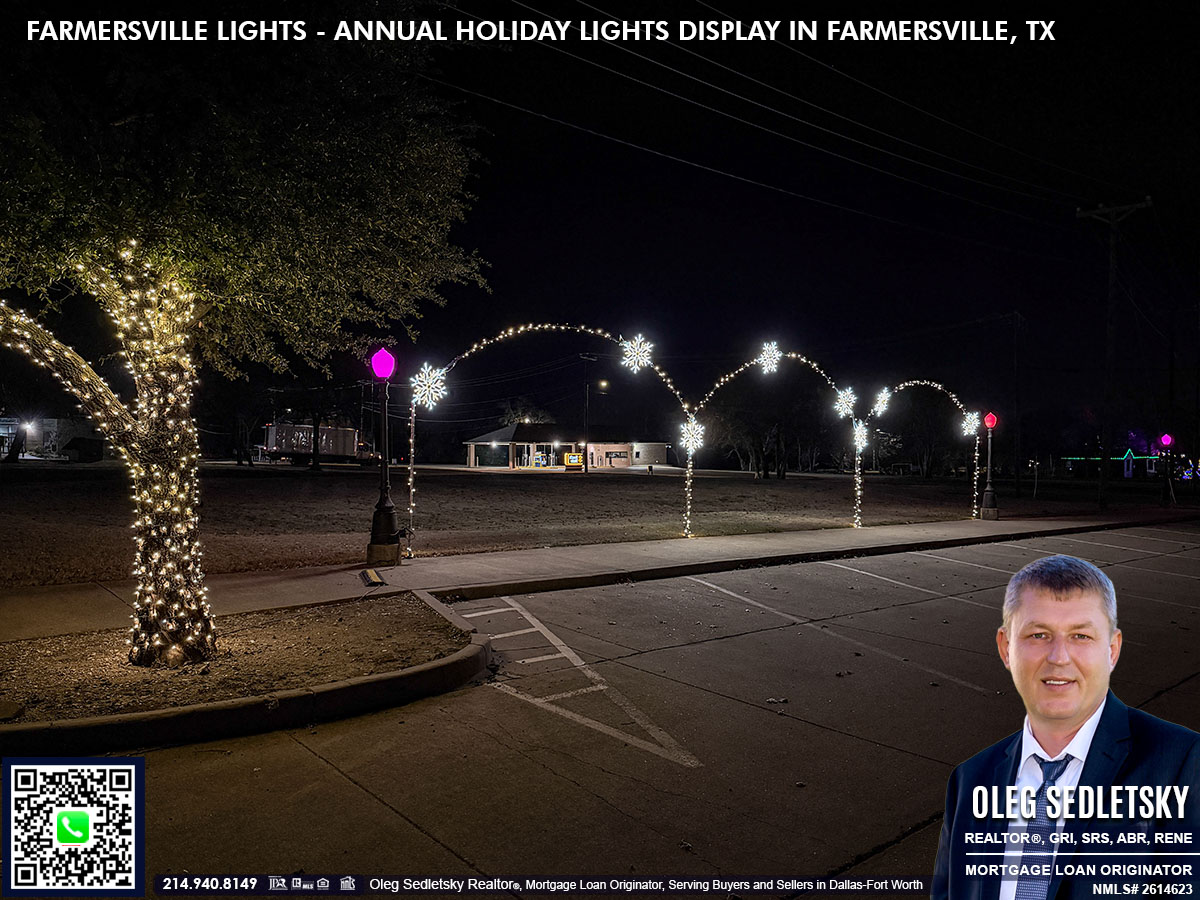
It’s All in the Details
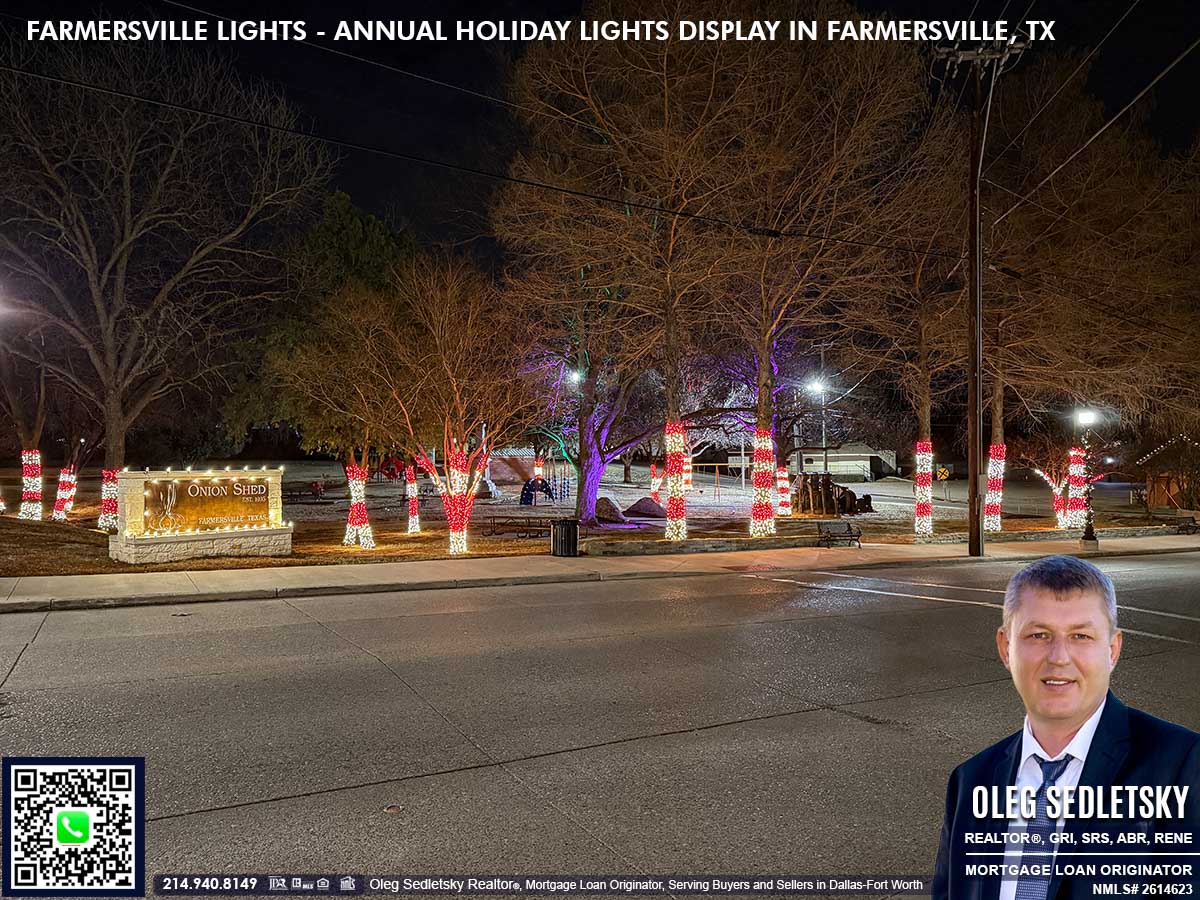
What makes the Farmersville Christmas lights display so remarkable are the thoughtful details. The city light poles flash different colors, adding to the joyful mood. At the intersection of Farmersville Parkway and Washington Street, trees are wrapped in ruby-red cascading lights, creating a beautiful separation from the surrounding golden glow. There is also a nativity set and light arches along the sidewalks, guiding your way.

Plan Your Perfect Visit to the Annual Holiday Magic
Each year, the Farmersville Lights shine throughout December, offering families ample time to enjoy the displays and create cherished traditions.
Throughout December, the town also hosts a variety of festive events, including the lighting ceremony, Farmersville Christmas Parade, Breakfast with Santa, the Farmersville Chamber 5k Rudolph Run & 1 Mile Fun Run, the Holiday LEGOS and trains exhibit, and many other fun activities for all ages.


Discover Farmersville, Texas for Yourself
The Farmersville Lights are a wonderful example of what makes this small North Texas city a great place to live. It shows a community that comes together to create something beautiful for everyone to enjoy.
If you are thinking about moving to the area and want to learn more about the lifestyle here, my Farmersville, TX Relocation Guide offers a deeper look into what this community has to offer. I am always happy to provide information to help prospective home buyers make educated decisions about where they want to build their future. This town is certainly one to consider.
Farmersville Lights: Frequently Asked Questions
What makes the Farmersville Christmas lights display so special compared to bigger city holiday events?
It really comes down to heart. While massive city displays can sometimes feel a bit corporate or manufactured, this event is a true labor of love. Many dedicated volunteers have worked tirelessly to bring the Farmersville lights to life since the very beginning. Think of it like the difference between a grandma’s homemade apple pie and one you buy at a gas station. The ingredients might be similar, but the warmth and community spirit here are just different.
Where exactly is the Farmersville Lights display located in Farmersville, Texas?
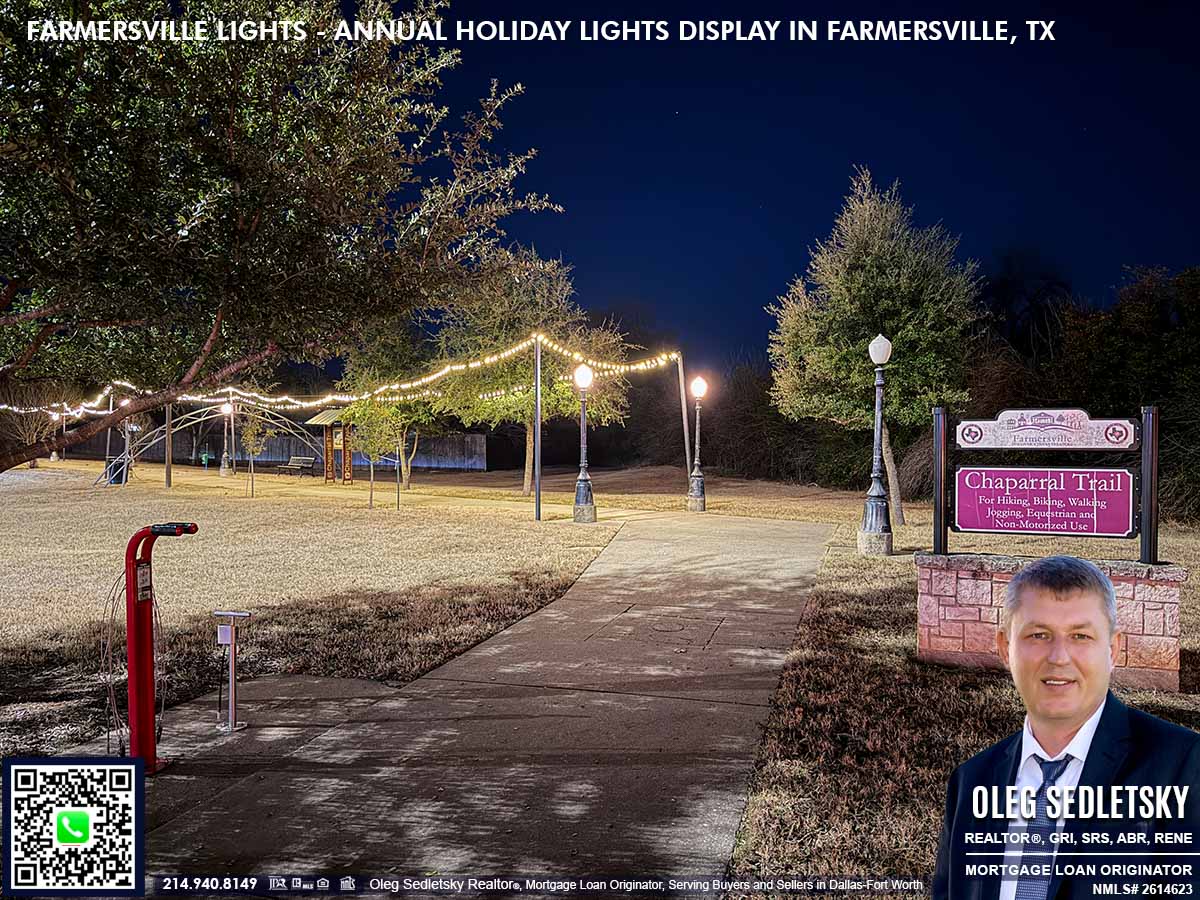
The display stretches out like a festive ribbon through town. The majority of it is concentrated on Farmersville Parkway, incorporating Rambler’s Park and the Robbin Lamkin Memorial Splash Pad. That section is approximately 0.6 miles long. From there, the trail of lights continues through Farmersville City Park and the Onion Shed before finishing up in the historic downtown area. Every year, the display evolves with new additions and enhancements, offering a fresh experience for visitors. This description captures the layout of the lights as they were showcased in 2025.
When do the Farmersville Christmas lights typically turn on each year?
The switch usually flips at the beginning of December. Once the season starts, the Farmersville lights run for about 30 days, giving you plenty of time to plan a visit with family and friends.
Is the Farmersville Lights display free to visit?
Yes, it is completely free to enjoy.
How long is the route for the Farmersville Christmas lights?
If you count all the different locations together, the total length of the route is approximately 1 to 1.2 miles.
Is the Farmersville Christmas lights display suitable for young children and families?
Absolutely. The event is designed with families in mind and is a safe, magical environment for visitors of all ages.
What other holiday activities happen in Farmersville during the Christmas season besides the lights?
There is actually a whole calendar of festive fun that occurs during December. Aside from the lights, you can catch the official lighting ceremony and the Farmersville Christmas Parade. For the little ones, there is Breakfast with Santa. If you are feeling active, check out the Farmersville Chamber 5k Rudolph Run and 1 Mile Fun Run. There is also a Holiday LEGOS and trains exhibit that is usually a big hit.
What do kids usually love most about visiting the Farmersville Christmas lights?
Beyond the dazzling lights themselves, kids love the variety. The interactive nature of walking the trail, seeing the Holiday LEGOS and trains exhibit, and the excitement of events like Breakfast with Santa make it a sensory playground for them.
Can you bring pets or dogs to see the Farmersville lights?
You can expect a quite loud atmosphere with large crowds gathering, children running around, and cars passing by. If your dog can tolerate this magnitude of stimulation, it might be okay. However, speaking as a responsible dog owner myself, I would not bring my dogs. It is hard to keep up with them in crowds, which creates potential for unpleasant situations. Also, before you go, please check with city authorities to confirm if dogs are officially permitted.
What time of night is best to visit the Farmersville Christmas lights to avoid crowds?
Check your favorite weather app to see when the sun sets, then plan to arrive 20 to 30 minutes later for the best visual experience. As you might guess, it is very busy on weekends. If you prefer a quieter stroll where you can really take your time, weeknights are your best bet.
How long does it typically take to walk through the entire Farmersville Lights display?
This depends entirely on your pace. If you are just walking to see it, you could finish in about 20 minutes. However, if you want to soak it in, take photos, and really enjoy the moment, plan for closer to 1.5 hours.
Is there parking or do you just drive through the Parkway for the Farmersville lights?
You have options. There are plenty of parking spaces along Farmersville Parkway and in the historic downtown area if you want to get out and explore on foot.
Where can you find the latest updates and dates for the Farmersville Lights each year?
For the most current information, including specific event schedules and dates, your best option is to check official Farmersville city resources like their website or Facebook page.
What nearby towns or attractions pair well with a visit to the Farmersville Christmas lights?
The nearest option is Princeton, Texas. They have their own holiday lights display in Princeton Municipal Park, so you could easily visit both in one evening for a double dose of holiday spirit.

Discover Farmersville Lights: Explore 120+ Photos in the Gallery


Are you ready to experience the joy of homeownership in the vibrant Dallas-Fort Worth area?
Whether you’re in search of an existing home or a brand-new construction, rest assured that I’m here to assist you every step of the way.
With a dedicated Realtor by your side, the home-buying process becomes a breeze. Say goodbye to stress, and let me handle all the intricate details on your behalf.
Getting the guidance you need is as simple as filling out a brief questionnaire on my Homebuyers contact form. From there, I’ll take care of everything, ensuring a seamless and hassle-free journey towards finding your dream home.
Call/Text 214.940.8149


How to Buy a House in Dallas-Fort Worth – The Complete Home Buying Process (New Rules Included)
371 Homes Sold in Dallas-Fort Worth in a Single Day: Learn How the Home Buying Process Works
Picture the scene on a single day in 2025. Specifically, December 1st, 2025. While many people were just starting to think about holiday shopping, 371 different families and individuals in Dallas-Fort Worth were doing something much bigger. They were signing papers, handing over checks, and receiving the keys to their new lives.
Those 371 transactions tell a fascinating story about our local market. On one end of the spectrum, someone picked up a property for $22,500. On the other end, a luxury buyer closed on an estate for $25.5 million. Somewhere in the middle, 95 people moved into brand-new construction homes that had never been lived in before.
If you are thinking about joining them, you might feel a mix of excitement and nerves. Buying a home in Texas is straightforward on paper, yet it involves many moving parts. This guide breaks down exactly what happens between deciding to buy and turning the key in your front door.

Is Buying a Home Actually Hard?
Let’s be honest: Buying a Home is a big decision!
It’s likely the biggest financial transaction of your life. While the mechanics are straightforward, the variables are endless. Every transaction has its own personality, hiccups, and triumphs.
Think of it like planning a wedding or a major trip. If you try to do it all in your head without a plan, it’s chaotic. But if you have a checklist and a guide, it becomes a series of manageable tasks.
Preparation is your secret weapon. The more you know before you start looking at listings, the less stress you’ll feel when it’s time to sign on the dotted line.
Your Step-by-Step Guide to Buying a Home in DFW
Whether you are looking in Dallas, Fort Worth, or anywhere else in North Texas, the process generally follows a specific rhythm.

1. The Decision Phase
Before you open a single real estate app, pause. Don’t make a spontaneous decision based on a pretty kitchen you saw on Instagram. Buying a home requires commitment. Weigh the pros and cons of your current situation. Are you ready to stay in one place? Are your finances stable? This is the moment to consult with a professional to see if your goals align with reality.
2. The Financial Reality Check (Get Pre-Approved!)
This step is non-negotiable. Before you fall in love with a house that might be out of reach, you need to know your numbers.
Getting pre-approved for a mortgage eliminates the guessing game. It gives you a concrete budget, which saves you time and heartache later. More importantly, in a market as active as DFW, sellers won’t even look at your offer without a pre-approval letter. It proves you are a serious buyer.
As a licensed Mortgage Loan Originator as well as a Realtor, I see this from both sides. When you have your financing lined up early, you walk into every showing with confidence.
3. Partner with a Real Estate Pro
Once your budget is set, it’s time to build your team. This is where connecting with a local Realtor® becomes vital.
A Realtor gives you access to active listings that you might miss on public sites. They handle the awkward conversations with sellers, schedule the tours, and keep the timeline moving.
Pro Tip: Look for someone who understands both the property and the financing. Having a dual expert on your side—someone who is an Accredited Buyer’s Representative (ABR) and a Mortgage Loan Originator—gives you a distinct advantage. You get holistic advice that protects both your lifestyle needs and your wallet.
4. 2026 Update: New Texas Rules
Real estate laws change, and it’s crucial to stay updated. As of 2026, Texas has implemented new regulations regarding buyer representation.
If you want an agent to actively guide you, show you properties, and negotiate for you, you must sign a standard residential buyer representation agreement. This isn’t just paperwork; it’s protection. It legally binds the agent to prioritize your interests above all else. It formalizes the relationship so you know exactly who is in your corner.
5. The Search
Now for the fun part! You are pre-approved, you have your representation agreement signed, and you are ready to hit the pavement.
Dallas-Fort Worth has incredible inventory, from historic charm to new construction homes.
- Identify your lists: Write down your “Must-Haves” (3 bedrooms, close to work), “Nice-to-Haves” (pool, granite counters), and “Deal-Breakers” (busy road, bad school district).
- Browse and Visit: Look online, but also go to open houses. Walk through neighborhoods at different times of the day.
Your Realtor will help you filter through the noise to find the homes that actually match your criteria.
6. Title Company Selection
This part confuses many first-time buyers. You will need to choose a title company to handle the ownership transfer and provide title insurance. If you aren’t sure who to pick, don’t worry, your agent can provide recommendations for reputable local companies that will ensure the property is legally yours, free and clear.
7. Making an Offer
You found “The One.” Your heart is racing. Now, you make an offer.
Your agent will help you draft a competitive offer based on market data, not just emotion. Be prepared to put down an “earnest money” deposit—this is a good-faith deposit that shows the seller you are committed. If they accept, you are officially under contract!
8. The Inspection
Never skip this step. Even a brand-new home can have issues. During your “option period” (a specific number of days you buy to inspect the home), hire a professional inspector. They will check the roof, foundation, electrical, and plumbing. This report gives you the chance to ask for repairs or, if the problems are too big, walk away.
9. Negotiation and Finalizing
Based on the inspection, we might go back to the negotiation table. Maybe the roof needs work, or the HVAC is older than expected. Your Realtor fights for you here to ensure the final contract terms (price and repairs) are fair.
10. The Lender’s Turn
Once the contract is finalized, your lender takes over. They will order an appraisal to ensure the home is worth the price and finalize your loan underwriting. This can take 30 to 60 days. Patience is key here!
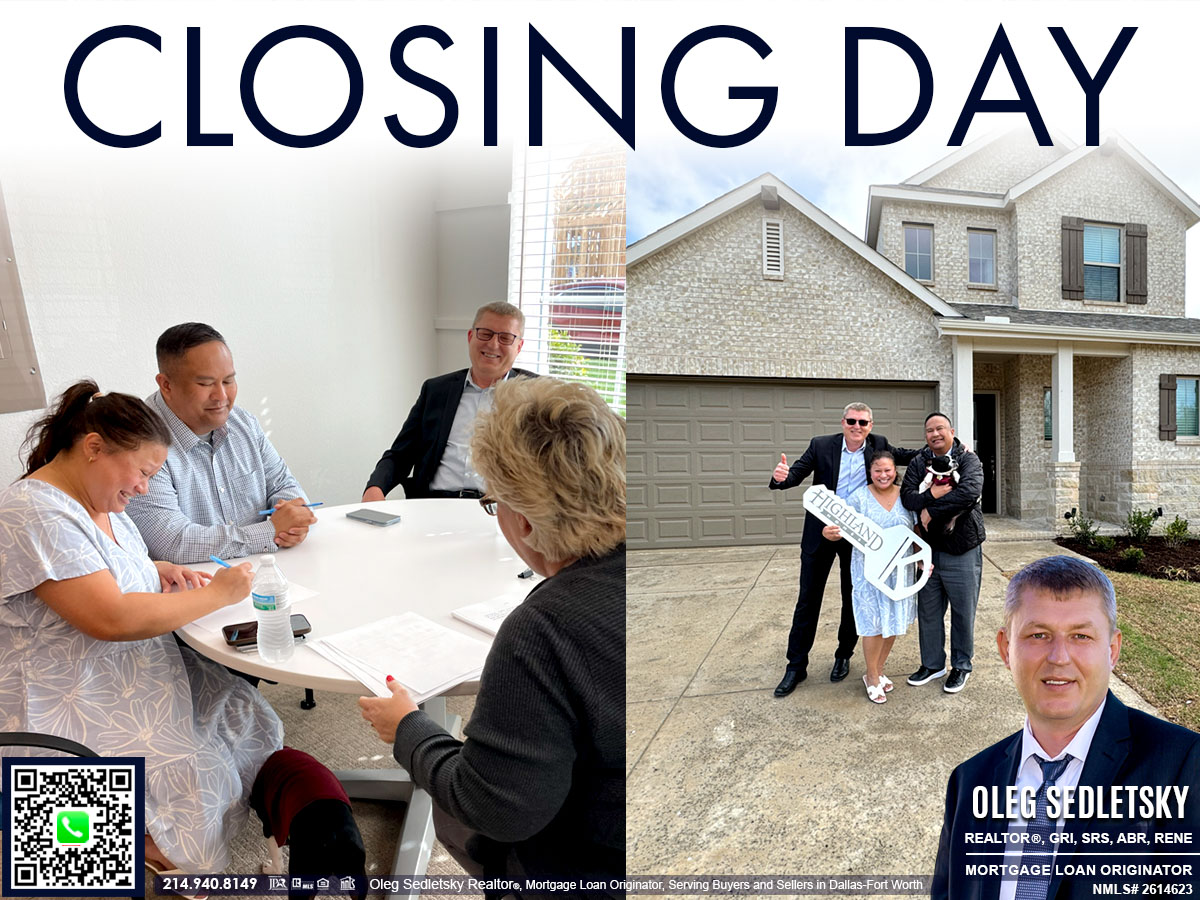
11. Closing Day
The finish line! Closing on a home is the grand finale of your hard work. You’ll meet at the title company, sign a stack of documents (remember, read before you sign!), and hand over your funds. Once the loan funds and the deed is recorded, the keys are yours.
Please Don’t Go It Alone-You Deserve an Advocate on Your Side
Picture the home buying process like setting off on a cross-country road trip. There are twists, exits, potholes, and sudden detours-maps and apps help, but having a trusted co-pilot makes all the difference. The paperwork, negotiations, and legal terms can feel overwhelming, but you don’t have to drive solo.
With a local expert beside you, you’ll have someone checking your blind spots and guiding you through every intersection. You’ll spot hidden risks before they become hazards and uncover opportunities that might otherwise sail by unnoticed. An advocate keeps your interests front and center, turning overwhelming moments into smooth sailing and ensuring your new keys come with a sense of ease, not regret.
If you’re thinking of buying-whether it’s your first home or your dream upgrade-I’m here to help with both your search and your financing.
Want more tips and resources?
Explore my website for dedicated resources for Dallas-Fort Worth home buyers, including relocation guides and detailed market articles.
Ready to talk about your next move?
Reach out anytime!


Hey Home Buyers! Are you excited to experience the joy of homeownership in the vibrant Dallas-Fort Worth area?
Buying a home in the Dallas-Fort Worth area should feel exciting, not overwhelming. Whether you’re eyeing a charming pre-owned house or a fresh new build, I’m here to make the home buying process simple and straightforward.
I’ll be here to answer your questions, handle the details, and make sure everything falls into place. My goal is to help you buy a home that checks all the boxes for you.
Let’s get started. Fill out my quick Homebuyers contact form and I’ll take it from there.
The Buyer’s Agent Duty
READ: Texas Real Estate Commission Information About Brokerage Services
AS AGENT FOR BUYER/TENANT: The broker becomes the buyer/tenant’s agent by agreeing to represent the buyer, usually through a
written representation agreement. A buyer’s agent must perform the broker’s minimum duties above and must inform the buyer of any
material information about the property or transaction known by the agent, including information disclosed to the agent by the seller or
seller’s agent.
A BROKER’S MINIMUM DUTIES REQUIRED BY LAW (A client is the person or party that the broker represents):
– Put the interests of the client above all others, including the broker’s own interests;
– Inform the client of any material information about the property or transaction received by the broker;
– Answer the client’s questions and present any offer to or counter–offer from the client; and
– Treat all parties to a real estate transaction honestly and fairly.
TO AVOID DISPUTES, ALL AGREEMENTS BETWEEN YOU AND A BROKER SHOULD BE IN WRITING AND CLEARLY ESTABLISH:
– The broker’s duties and responsibilities to you, and your obligations under the representation agreement.
– Who will pay the broker for services provided to you, when payment will be made and how the payment will be calculated.
TYPES OF REAL ESTATE LICENSE HOLDERS:
– A BROKER is responsible for all brokerage activities, including acts performed by sales agents sponsored by the broker.
– A SALES AGENT must be sponsored by a broker and works with clients on behalf of the broker.
Latest from Dallas Real Estate Blog
– Texas Homebuyers Tips, Tricks and Lifehacks
– New Construction Homes in Dallas TX
– Mortgages for Homebuyers and Investors in Dallas-Fort Worth


2026 New Texas Real Estate Rules: What Homebuyers Need to Know
The ground is shifting under the Texas real estate market. If you plan to buy a home starting January 1, 2026, the experience will be noticeably different from what your friends or family went through. The old ways of casually calling an agent from a yard sign for a spontaneous tour are officially a thing of the past.
New statewide regulations have redrawn the map for how homebuyers and real estate agents must interact.
While the phrase “new laws” can sound complex, these changes are built to be your shield. They act like installing bright, clear street signs in a neighborhood that was once confusing to navigate. They bring much needed clarity to who is on your team, what they are hired to do, and how they are paid. This guide is your compass for understanding the new rules and what to expect on your homebuying journey.
Key Takeaways
Which law is discussed here?
This post breaks down Texas Senate Bill 1968 (Texas Legislature Online – SB 1968,) a law that includes amendments to the Occupations Code. We are focusing on Section 1101.563, which establishes that a WRITTEN AGREEMENT IS REQUIRED before an agent can provide services. This law took effect on January 1, 2026.
Who is affected?
Homebuyers: You must now sign a written agreement before an agent can show you a home or help you write an offer.
Real estate license holders: Agents and brokers are legally required to have this signed agreement with you before they can start working on your behalf.
Who is not affected?
These new rules do NOT apply to sellers, commercial property deals, or raw land transactions.
Where can you find the Section 1101.563?
You can access Section 1101.563 within the Texas Occupations Code on the official Texas Legislature website (capitol.texas.gov): statutes.capitol.texas.gov → Occupations Code → Chapter 1101 → Section 1101.563
https://statutes.capitol.texas.gov/?tab=1&code=OC&chapter=OC.1101&artSec=1101.563
What is in the Law: Key Provisions of SB 1968
Mandatory Written Agreements – Occupations Code, Section 1101.563
License holders must now enter into a written agreement with a buyer before they can show a residential property or make an offer. You cannot tour a home with an agent without first signing a document that defines your relationship. This ensures clarity regarding duties and compensation from the very first meeting.
Elimination of Subagency
The new law removes “subagency” entirely. Previously, an agent could help a buyer while legally representing the seller. This caused confusion about loyalty. Now, an agent either represents you, represents the seller, or acts as an intermediary. The lines of representation are absolute.
“Showing Without Representation” Option
If you want to view a home without hiring an agent, you can. A broker may show a property without a representation agreement, but they must provide a specific written notice in at least 10-point font. This notice states the broker does not represent you. During these showings, the broker cannot offer advice, opinions, or negotiation help.
Negotiable Compensation Disclosure
Written agreements must now conspicuously state that broker compensation is fully negotiable. The documents will clarify that commission rates are not set by law, ensuring you understand that fees are a matter of contract between you and your broker.
Broker Education Requirements
All brokers, even those who do not sponsor other agents, must complete the Broker Responsibility Course to renew or apply for a license. This ensures every broker remains up to date on compliance and legal standards.
Enhanced Oversight
The Texas Real Estate Commission (TREC) now has expanded authority to manage license information. This includes publicly displaying the names of associated brokers and requiring updated business contact details, making it easier for the public to verify agent credentials.
Visit Texas Legislature Online to read the full text of Senate Bill 1968. Texas Legislature Online – SB 1968,
Section 1101.563 Explained: Written Agreement Required Before Showing a Property
The most immediate change you will encounter happens before you even set foot inside a potential new home. The new law mandates that a real estate professional must have a signed written agreement (Buyer Representation Agreement) with you before showing you a residential property. This includes single-family homes, duplexes, condos, and co-ops.
Previously, an agent might have offered a “try before you buy” approach, showing you a few homes to build rapport before presenting a contract. Now, the law moves that paperwork to the very beginning of the relationship. If you ask an agent to show you a home and they present a document to sign first, they are not being pushy; they are complying with Texas law.
This agreement is far more than a formality. Think of it as the blueprint for your entire homebuying project. It must clearly outline several key points:
- The specific services the agent will perform for you.
- The exact details of the agent’s compensation.
- A clear distinction on whether the agent is your dedicated representative (“Full Service”) or is simply providing access to a property (“Showing Only”).
- An upfront statement confirming that real estate fees are not set by law and are fully negotiable.
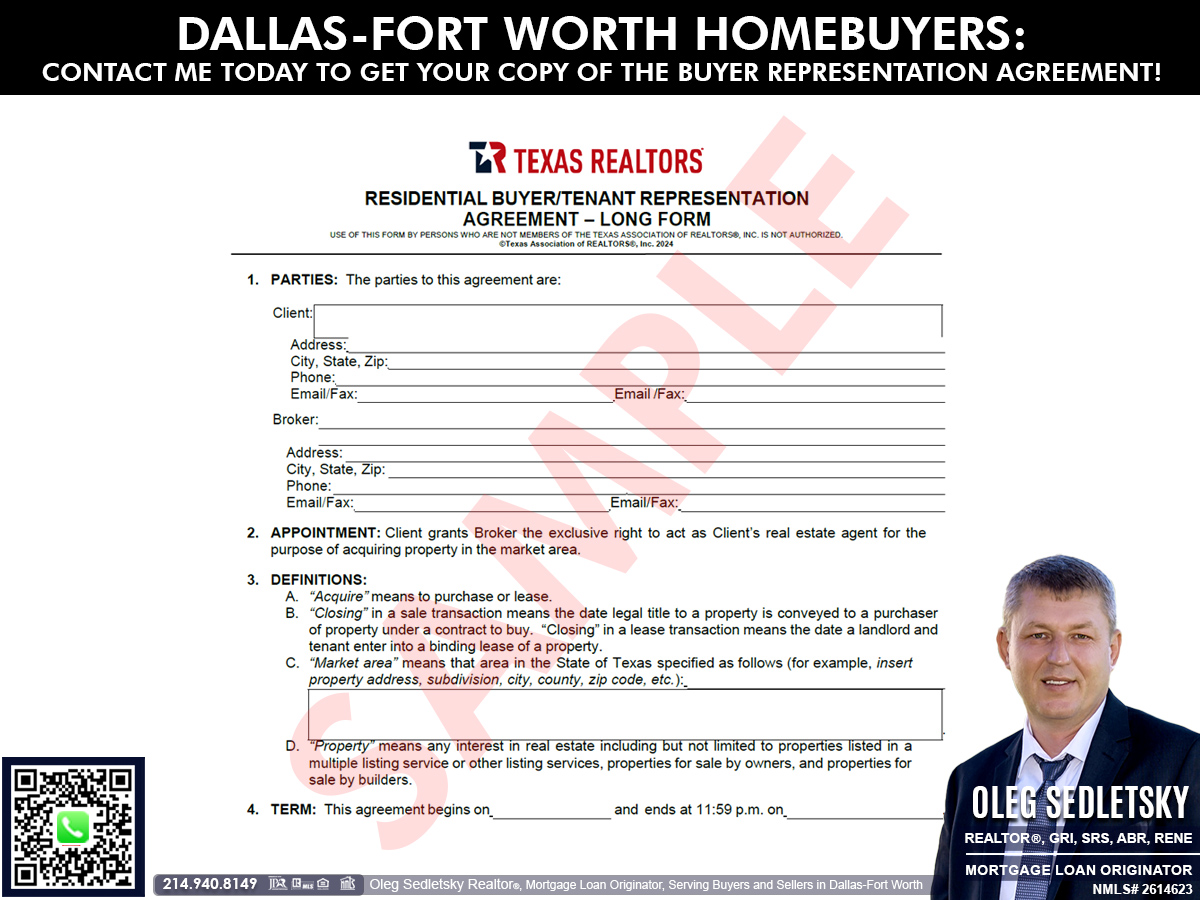
“Just Looking” vs. Hiring a Dedicated Agent
The new rules create a clear fork in the road, requiring you to choose your path when you want to see a property.
Path 1: The “Showing Only” Route
If you are not ready to commit to an agent but want to tour a specific house, the law permits a broker to unlock the door for you without officially representing you. This path, however, comes with significant limitations. The broker can only provide basic, factual information, like the home’s square footage or the seller’s asking price. They are forbidden from offering advice, opinions on value, or negotiation strategies.
This person is like a museum guard. They can let you into the gallery and point you toward the exit, but they cannot explain the art’s history or tell you if a painting is a wise investment. An agreement for this limited service cannot last more than 14 days and must be non-exclusive, so you are free to work with others. This option is fine for casual browsing, but it is vital to remember the person opening the door is not on your team.
Path 2: Full Buyer Representation
If you want an expert in your corner to provide guidance, negotiate fiercely on your behalf, and offer professional advice, you will sign a buyer representation agreement. This document establishes a formal agency relationship where the agent owes you fiduciary duties. This is a legal promise to put your best interests above all else. You are no longer just looking at houses; you have hired a dedicated professional to advocate for your success.
Why Working With a Realtor® Holding an ABR® Designation Matters

A real estate transaction is a high-stakes financial puzzle with countless moving parts. For first-time buyers, it can feel like trying to navigate a foreign country without a map. This is where your choice of professional guide becomes the most important decision you will make. As a Realtor® with the Accredited Buyer’s Representative (ABR®) designation, I am specifically equipped to lead you through this process with confidence.
What is an ABR® Designation, and who has it?
The ABR® designation is the gold standard for buyer representation. It is awarded by the Real Estate Buyer’s Agent Council (REBAC), a branch of the National Association of REALTORS®, to agents who have completed advanced education and proven their experience in effectively representing homebuyers. When you see Realtor®, ABR® on a business card, you know you are speaking with a specialist.
Here is the advantage you gain by hiring a Realtor® with an ABR® designation:
Specialized Training
My ABR® training was focused exclusively on the buyer’s side of the transaction. I am trained to anticipate challenges, protect your interests, and guide you through every decision point.
Expert Negotiation
Alongside my ABR®, I earned the Real Estate Negotiation Expert (RENE) certification. This means I have advanced skills in crafting strategies to secure the most favorable terms possible for you.
Fiduciary Focus
I only offer full representation because my commitment as an ABR® designee is to be your advocate. My role is to serve your best interests at every turn, from the first showing to the moment you get your keys. I do not just open doors; I open opportunities.
Clarity and Ethics
The ABR® designation requires adherence to a strict code of ethics. My job is to ensure you understand every document and every step, so you always feel empowered, not pressured.
But wait, there is more!
Think for a moment about how many agents you have met with this level of training. My full set of credentials includes: GRI, SRS, ABR®, RENE, and SFR. You can learn about what each of these means for you on my dedicated page READ: My Real Estate Designations and Certifications.
But wait, there is even more! A Mortgage Expert is on your side too!
As a licensed Mortgage Loan Originator, I bring a dual expertise that is rare in this industry. I can guide you not just on the property, but also on the financing that secures it, giving you a powerful strategic advantage.
Why the New Rules Are Good News for Buyers
While change can feel inconvenient, these new regulations bring a level of transparency that empowers you.
No More Guesswork on Fees
In the past, agent compensation was often a mystery to buyers. The Buyer Representation Agreement demands an open conversation about fees from day one. You will know exactly what your agent charges, and the law reinforces that these fees are negotiable.
You Know Who Is on Your Team
Have you ever toured an open house, shared your budget and dreams with the friendly host, only to discover later they worked exclusively for the seller? These new rules eliminate that confusion. Your Buyer Representation Agreement clarifies in writing whether someone works for you or is just unlocking a door.
Defined Services
You get to see precisely what you are signing up for. The agreement acts as a menu of services. If you only want limited assistance, you can sign a limited agreement. If you want a dedicated expert, you sign a full Buyer Representation Agreement. You are in complete control.
4 Tips for Navigating the 2026 Market
As you get ready to enter the market, keep these tips in mind.
1. Do Not Fear the Form
When an agent presents an agreement before a showing, stay calm. Review it carefully, but understand this is the new standard operating procedure. An agent who doesn’t ask you to sign should be a red flag.
2. Check the Expiration Date
Look closely at the contract’s termination date. On a first meeting, you may not want to commit to a six-month term. You can request a shorter period, even just a day or a week, while you decide if the agent is the right fit. Remember, “showing only” agreements cannot exceed 14 days.
3. Ask About Exclusivity
An agreement will state if it is exclusive or non-exclusive. “Exclusive” means you commit to working only with that agent. “Non-exclusive” keeps your options open. A non-exclusive agreement can be a smart choice for an initial meeting.
4. Have the Money Talk Early
Use the agreement as a natural opportunity to discuss compensation. Ask how the agent is paid and discuss the protocol if a seller does not offer to cover the fee. Clarifying this upfront prevents unwelcome surprises down the road.
A Clearer Path to Homeownership
Buying a home is one of the most significant financial decisions of your life. These new rules ensure you are not walking into it with a blindfold on. By requiring written agreements and clear service definitions, Texas is empowering you to make smarter, more confident choices. So get your pen ready. That signature is your first step toward a transparent and protected homebuying experience.
Hey Home Buyers! Are you excited to experience the joy of homeownership in the vibrant Dallas-Fort Worth area?
Buying a home in the Dallas-Fort Worth area should feel exciting, not overwhelming. Whether you’re eyeing a charming pre-owned house or a fresh new build, I’m here to make the home buying process simple and straightforward.
I’ll be here to answer your questions, handle the details, and make sure everything falls into place. My goal is to help you buy a home that checks all the boxes for you.
Let’s get started. Fill out my quick Homebuyers contact form and I’ll take it from there.
The Buyer’s Agent Duty
READ: Texas Real Estate Commission Information About Brokerage Services
AS AGENT FOR BUYER/TENANT: The broker becomes the buyer/tenant’s agent by agreeing to represent the buyer, usually through a
written representation agreement. A buyer’s agent must perform the broker’s minimum duties above and must inform the buyer of any
material information about the property or transaction known by the agent, including information disclosed to the agent by the seller or
seller’s agent.
A BROKER’S MINIMUM DUTIES REQUIRED BY LAW (A client is the person or party that the broker represents):
– Put the interests of the client above all others, including the broker’s own interests;
– Inform the client of any material information about the property or transaction received by the broker;
– Answer the client’s questions and present any offer to or counter–offer from the client; and
– Treat all parties to a real estate transaction honestly and fairly.
TO AVOID DISPUTES, ALL AGREEMENTS BETWEEN YOU AND A BROKER SHOULD BE IN WRITING AND CLEARLY ESTABLISH:
– The broker’s duties and responsibilities to you, and your obligations under the representation agreement.
– Who will pay the broker for services provided to you, when payment will be made and how the payment will be calculated.
TYPES OF REAL ESTATE LICENSE HOLDERS:
– A BROKER is responsible for all brokerage activities, including acts performed by sales agents sponsored by the broker.
– A SALES AGENT must be sponsored by a broker and works with clients on behalf of the broker.
Latest from Dallas Real Estate Blog
– Texas Homebuyers Tips, Tricks and Lifehacks
– New Construction Homes in Dallas TX
– Mortgages for Homebuyers and Investors in Dallas-Fort Worth
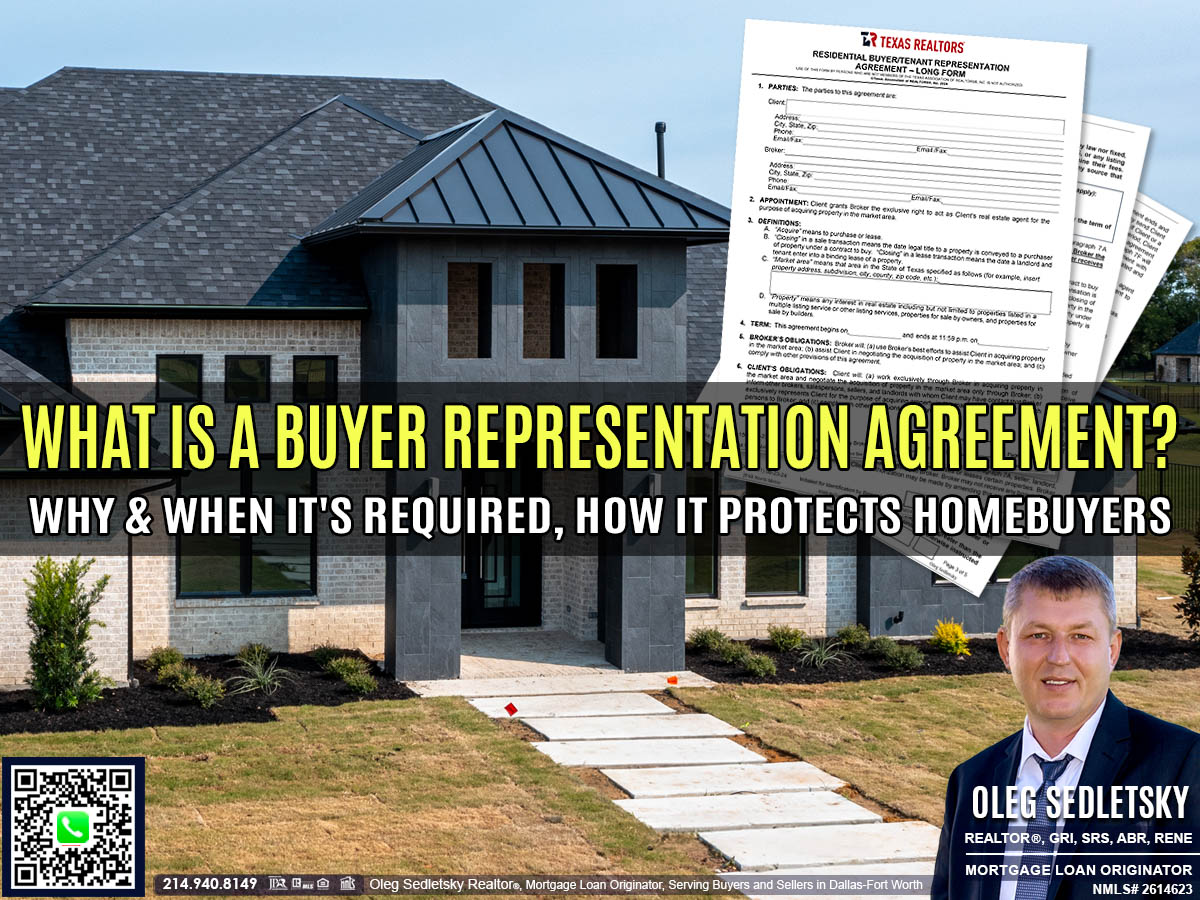
Texas Buyer Representation Agreement: What is it, Why and When It's Required, What to Know Before You Sign
The One Document Every Dallas-Fort Worth Homebuyer Must Sign Starting 2026
Buying or leasing a home in Texas means a stack of forms will land in front of you, and one of the first is the Buyer/Tenant Representation Agreement.
If you want a Realtor® to help you find or tour a property, signing this agreement is no longer optional.
Paperwork may not be the exciting part of finding a new home, but this document matters. It defines your relationship with your real estate agent and sets the ground rules for your home search. With the new Texas real estate law now in effect, understanding this agreement is more important than ever.
Here’s what you should know before you sign.
Key Takeaways
- A Buyer/Tenant Representation Agreement hires a real estate agent to represent you and only you in a real estate transaction.
- From 2026 onward, You must sign a Buyer/Tenant Representation Agreement before a Realtor® can show you any properties in Texas.
- Working with an ABR® Realtor® gives you a knowledgeable advocate focused on your needs as a buyer.
- The agreement is legally binding. Read thoroughly and consider legal advice before you sign.
What is a Residential Buyer/Tenant Representation Agreement?
A Buyer/Tenant Representation Agreement is a legal contract that formalizes the working relationship between you (the client) and your real estate agent’s brokerage (the broker). Think of it as an employment contract. You are hiring a professional to represent your best interests during the home-buying or leasing process.
What does it do?
The Buyer/Tenant Representation Agreement clearly outlines the duties and responsibilities of both parties.
It creates an agency relationship, which legally obligates your agent to act in your best interest, maintain confidentiality, and provide guidance throughout the transaction. It’s designed to ensure transparency and commitment from the start.
Why is This Agreement Necessary?
The requirement to sign this agreement upfront ensures that all parties understand their roles and obligations. It protects you by guaranteeing your agent works exclusively for you, not the seller. It also protects the agent, ensuring they will be compensated for their time, expertise, and effort in helping you find a property.
Before this change, some buyers would view homes with an agent without a formal agreement, creating potential confusion about loyalty and compensation. The new rule, effective January 1, 2026, standardizes the process. It ensures that from the moment you start looking at homes with an agent, you have a dedicated advocate committed to your goals.
Who Will Benefit From It?
You benefit most from this agreement. Having a dedicated advocate ensures someone is looking out for your financial and personal interests. You get professional advice on market value, help with due diligence, and skilled negotiation.
The agent also benefits because they know you are committed to working with them. This allows them to invest their time, resources, and expertise into finding you the right home without worrying that you will use another agent after they have done the work.
Can You Not Sign It?
If you want a Realtor® to assist you, signing the Buyer/Tenant Representation Agreement is required. This step ensures a professional relationship and access to their services.
However, if you choose not to work with an agent, you are not obligated to sign the agreement.
Does TREC provide a buyer representation agreement?
No, TREC does not issue or regulate these agreements. They are private contracts between a buyer and a real estate broker.
Where can you get the Residential Buyer/Tenant Representation Agreement?
This document is typically provided by the real estate brokerage. Ask your Realtor® for a copy.
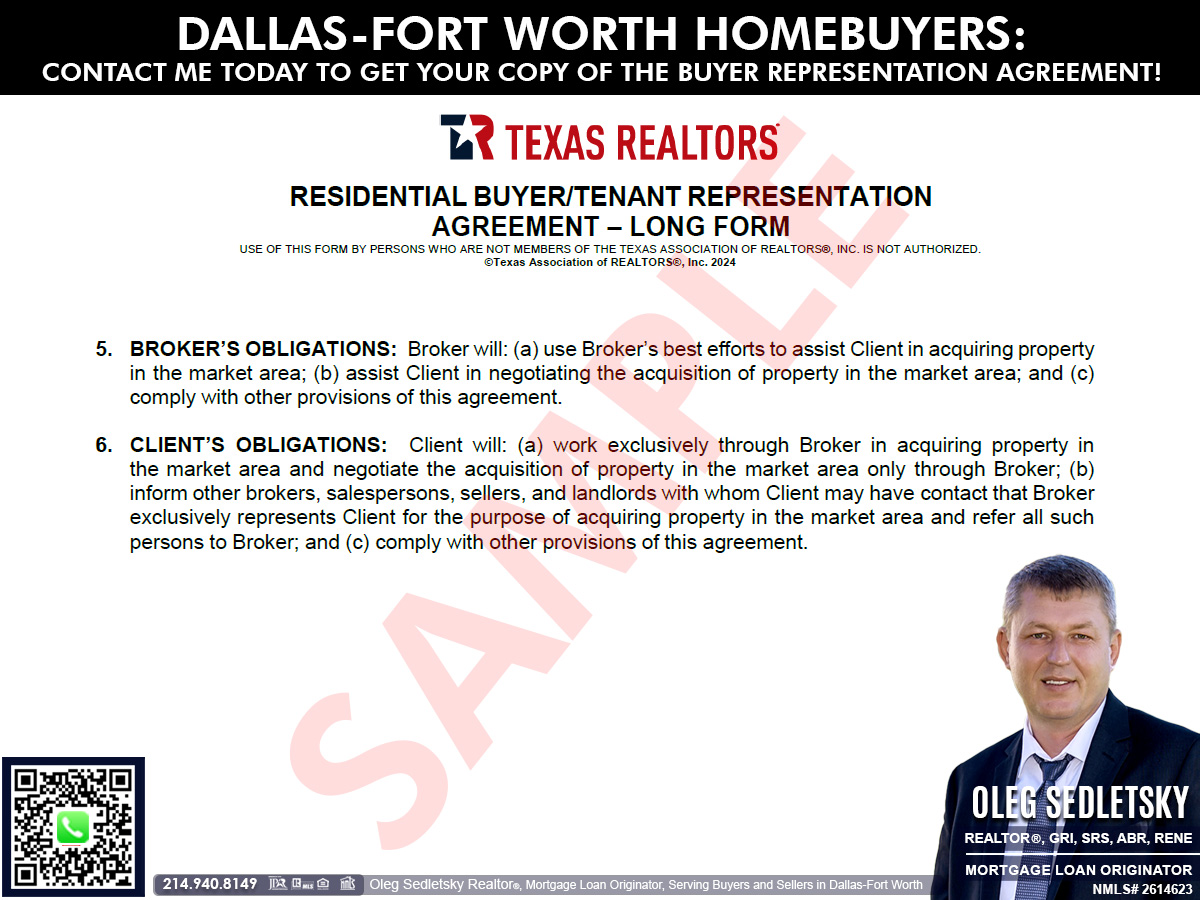
Key Sections of the Buyer Representation Agreement Explained
While the legal language can seem dense, the agreement covers several straightforward concepts. Here’s a simple breakdown of the most important sections you will encounter.
1. Appointment and Term
This section officially appoints the broker as your exclusive agent for a specific period. The “Term” defines the start and end dates of the agreement. This means that during this time, you agree to work solely with this agent and their brokerage to find a property in the defined “Market Area.”
2. Broker and Client Obligations
The agreement details what you can expect from your agent and what is expected of you.
- Broker’s Obligations: Your agent commits to using their best efforts to find you a suitable property, assist with negotiations, and handle the transaction professionally.
- Client’s Obligations: You agree to work exclusively through your chosen broker. This means you will direct any inquiries about properties to your agent and inform other agents or sellers that you are already represented.
3. Broker Compensation
This is one of the most critical sections. It details how your agent gets paid for their services.
- How Fees are Determined: Real estate commissions are negotiable and are not set by law. The fee is typically a percentage of the property’s sale price or a flat fee.
- Source of Payment: Your agent will first seek payment from the seller or landlord. In most Texas transactions, the seller pays the buyer’s agent’s commission. However, if the seller refuses or the amount offered is less than the agreed-upon fee, you are responsible for paying the difference. This is an important detail to discuss with your agent.
- Protection Period: This clause protects the agent’s commission for a set number of days after the agreement ends. If you buy a property that your agent showed you during the agreement’s term, you may still owe them the commission.
4. Intermediary Status
What happens if you fall in love with a home that is also listed by your agent’s brokerage? This is called an “intermediary” situation. The agreement outlines how this is handled. Your agent must remain neutral and follow specific rules to ensure both you and the seller are treated fairly. You can decide whether you are comfortable with this arrangement when you sign the agreement.
The Advantage of Hiring an ABR® Realtor®
When choosing a Realtor® to sign this agreement with, look for one with an Accredited Buyer’s Representative (ABR®) designation.
This isn’t just another set of letters after their name. It means they have completed specialized training focused on the needs of homebuyers.
An agent with an ABR® designation has completed specialized training, has a proven track record, and has a deeper understanding of their duties to you as a buyer.
These professionals are equipped to perform a thorough needs assessment, find the right properties, analyze property values, identify potential red flags, and strategically negotiate on your behalf. Since you are committing to a single agent, choosing one with this advanced credential is a smart move.
Think of it this way: when you need specialized medical care, you seek out a specialist. Similarly, when you are making one of the largest financial investments of your life, it makes sense to work with a specialist in buyer representation.
Read Before You Sign: Protect Yourself With Legal Advice.
The Buyer/Tenant Representation Agreement is not just paperwork. Once you sign, you’re locked into a legal contract with real consequences. Your real estate agent can walk you through the details and answer your questions about the process, but only a lawyer can give you legal advice.
Don’t rush through this step. Go over every section and make sure you understand what you’re agreeing to. If anything is unclear or you want a second opinion, contact a real estate attorney to check the agreement before you put your name on it. This simple step can keep you out of trouble and give you peace of mind before moving forward.
How to Navigate the Process
The Buyer/Tenant Representation Agreement is a tool for your protection. It ensures you have a qualified professional looking out for you.
Here are a few practical tips:
- Interview Agents: Don’t feel pressured to sign with the first agent you meet. Interview a few candidates. Ask about their experience, their communication style, and specifically if they hold the ABR® designation.
- Read the Agreement: Take the time to read the entire document. Ask your agent to walk you through each section and clarify anything you don’t understand. Pay close attention to the term length and any termination clauses.
- Negotiate the Terms: Remember that the terms of the agreement are negotiable. If you feel a six-month term is too long, you can propose a shorter period. A good agent will be willing to find terms that work for both of you.
By understanding the Texas Buyer/Tenant Representation Agreement and the value of working with an ABR® designee, you can confidently take the next step in your home-buying journey. This agreement isn’t just another piece of paper; it’s the foundation of a successful partnership that empowers you to find the perfect home with an expert by your side.
What’s the Next Step?
Understanding the Buyer/Tenant Representation Agreement is an important step in the home buying process. Now that you have a clearer picture of what this agreement means for you, the next move is to secure expert guidance tailored to your specific situation. Navigating the real estate market involves more than just finding the right property; it also requires a solid financial strategy. This is where having a professional with dual expertise can make a significant difference.
Choose an Experienced Professional Who Knows Both Sides
A professional with both a Realtor® ABR designation and a mortgage loan originator license brings a well-rounded perspective. The Accredited Buyer’s Representative (ABR) designation shows a strong commitment to supporting buyers’ interests. When paired with extensive mortgage knowledge, it provides a unique advantage, giving you practical advice on affordability, structuring offers, and navigating the mortgage process—all from one trusted resource.


Let’s Discuss Your Real Estate and Mortgage Needs
Are you ready to take the next step toward homeownership with confidence?
I’m Oleg Sedletsky, a Realtor® with the ABR designation and a licensed mortgage loan originator.
My job is to keep things simple and stress-free, whether you’re ready to jump in or just want some straight talk about your next move.
Reach out for an easy, no-pressure chat. Tell me what you’re aiming for, and I’ll help you put a plan together to get there.
Hey Home Buyers! Are you excited to experience the joy of homeownership in the vibrant Dallas-Fort Worth area?
Buying a home in the Dallas-Fort Worth area should feel exciting, not overwhelming. Whether you’re eyeing a charming pre-owned house or a fresh new build, I’m here to make the home buying process simple and straightforward.
I’ll be here to answer your questions, handle the details, and make sure everything falls into place. My goal is to help you buy a home that checks all the boxes for you.
Let’s get started. Fill out my quick Homebuyers contact form and I’ll take it from there.
The Buyer’s Agent Duty
READ: Texas Real Estate Commission Information About Brokerage Services
AS AGENT FOR BUYER/TENANT: The broker becomes the buyer/tenant’s agent by agreeing to represent the buyer, usually through a
written representation agreement. A buyer’s agent must perform the broker’s minimum duties above and must inform the buyer of any
material information about the property or transaction known by the agent, including information disclosed to the agent by the seller or
seller’s agent.
A BROKER’S MINIMUM DUTIES REQUIRED BY LAW (A client is the person or party that the broker represents):
– Put the interests of the client above all others, including the broker’s own interests;
– Inform the client of any material information about the property or transaction received by the broker;
– Answer the client’s questions and present any offer to or counter–offer from the client; and
– Treat all parties to a real estate transaction honestly and fairly.
TO AVOID DISPUTES, ALL AGREEMENTS BETWEEN YOU AND A BROKER SHOULD BE IN WRITING AND CLEARLY ESTABLISH:
– The broker’s duties and responsibilities to you, and your obligations under the representation agreement.
– Who will pay the broker for services provided to you, when payment will be made and how the payment will be calculated.
TYPES OF REAL ESTATE LICENSE HOLDERS:
– A BROKER is responsible for all brokerage activities, including acts performed by sales agents sponsored by the broker.
– A SALES AGENT must be sponsored by a broker and works with clients on behalf of the broker.
Latest from Dallas Real Estate Blog
– Texas Homebuyers Tips, Tricks and Lifehacks
– New Construction Homes in Dallas TX
– Mortgages for Homebuyers and Investors in Dallas-Fort Worth